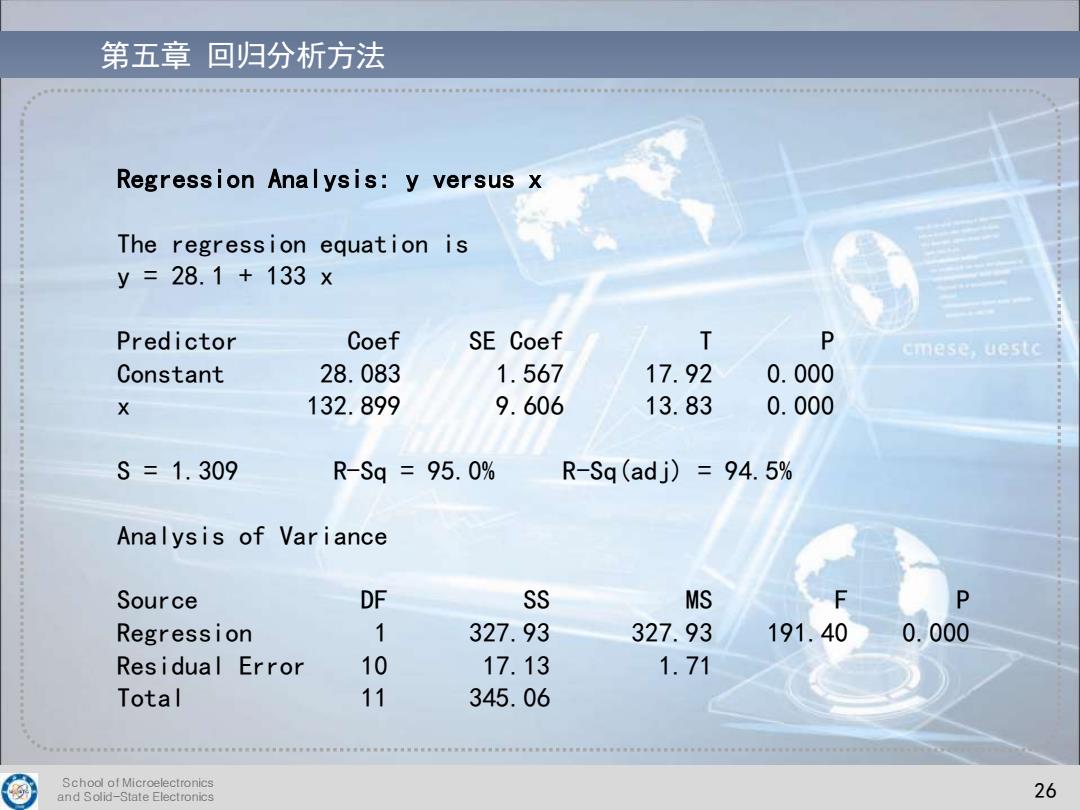
第五章回归分析方法 Regression Analysis:y versus x The regression equation is y=28.1+133× Predictor Coef SE Coef T P cmese,uestc Constant 28.083 1.567 17.92 0.000 X 132.899 9.606 13.83 0.000 S=1.309 R-Sq=95.0% R-Sq(adj)=94.5% Analysis of Variance Source DF SS MS P Regression 1 327.93 327.93 191.40 0.000 Residual Error 10 17.13 1.71 Total 11 345.06 School of Microelectronics and Solid-State Electronics 26
School of Microelectronics and Solid-State Electronics 26 第五章 回归分析方法 Regression Analysis: y versus x The regression equation is y = 28.1 + 133 x Predictor Coef SE Coef T P Constant 28.083 1.567 17.92 0.000 x 132.899 9.606 13.83 0.000 S = 1.309 R-Sq = 95.0% R-Sq(adj) = 94.5% Analysis of Variance Source DF SS MS F P Regression 1 327.93 327.93 191.40 0.000 Residual Error 10 17.13 1.71 Total 11 345.06
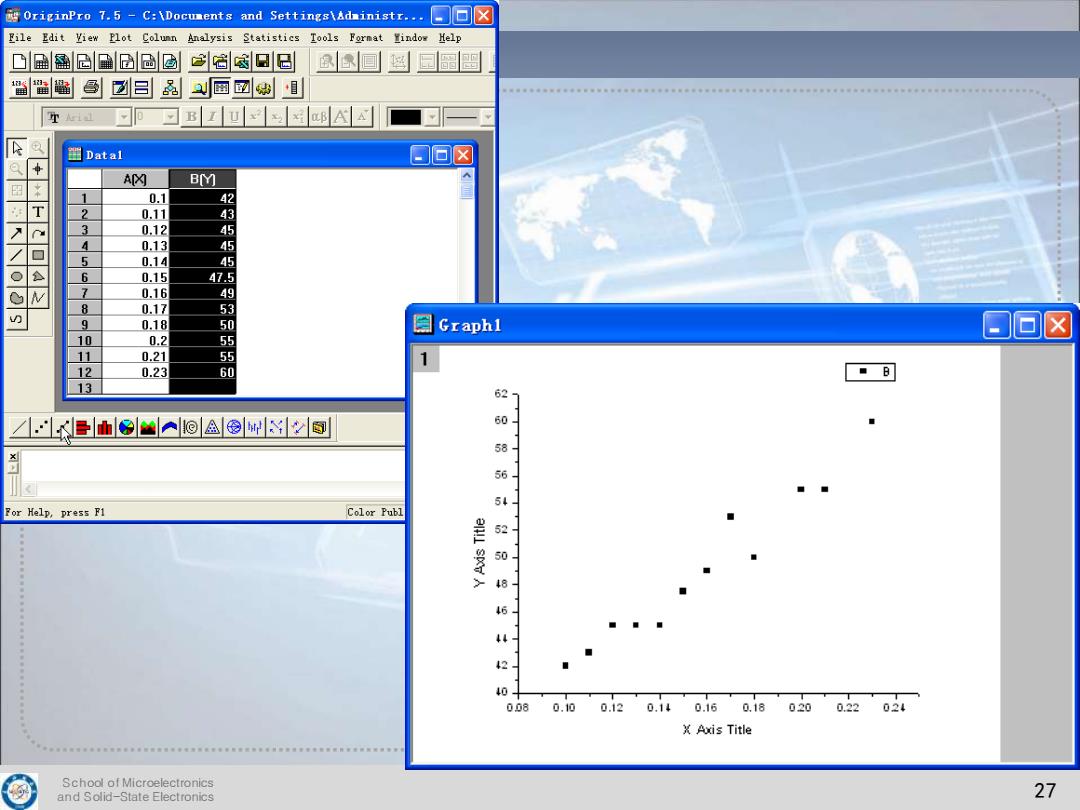
OriginPro 7.5-C:ADocuments and Settings\Adsinistr...□▣☒ File Edit Yiew Plot Colunn Analysis Statistics Tools Help 翻园■回@日 回 馏昼☑吕品到画回缚目 可▣Bzu邱A 闺Datal 口回☒ A内 BM 0.1 42 T 2 0.11 43 0.12 45 4 0.13 45 5 0.14 45 6 0.15 47.5 7 0.16 49 0.17 3 9 0.18 目Graph1 日回☒ 10 0.2 55 11 0.21 55 1 12 0.23 60 13 ☑人子山好A盈®树回 56 54 For Help,press F1 Color Publ ◆ 0 48 46 ◆ ■ 40 008 0.10 0.120.140.160.18020 0.22024 X Axis Title School of Microelectronics and Solid-State Electronics 27
School of Microelectronics and Solid-State Electronics 27 第五章 回归分析方法
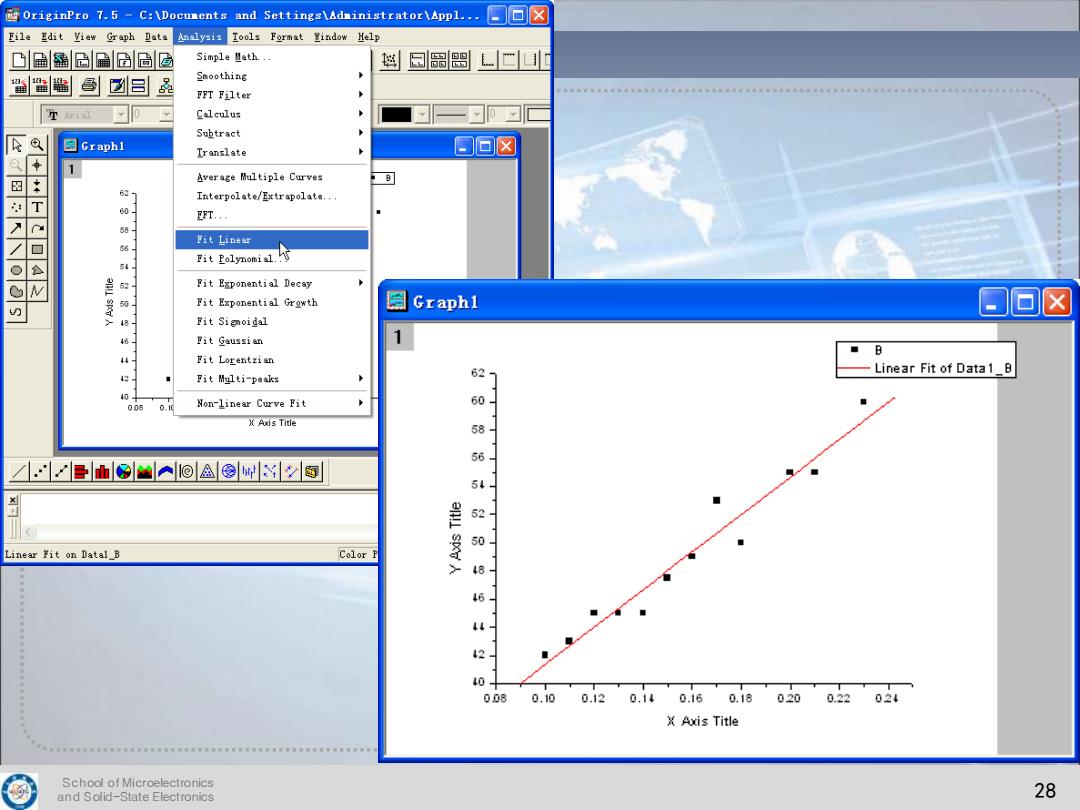
OriginPro7.5-C:Documents and Settings\Adainistrator\App1...□回☒ File Edit iewG红aph卫ata isi Iools Format Yindow Help 凸鑫鱼周 Simple且ath.. 幽☒吕品 Smoothing FFT Filter Calculus Suktract 图Cxaph1 Translate A 日▣☒ Average Multiple Curves 627 Interpolate/Extrapolate. T EFT... 58 Fit Linear 公M 54 Fit Eolymomi s Fit Esponential Decay 50- Fit Exponential Growth 目Graph1 日回☒ Fit Sigoidal Fit Gaussian 1 ■ B Fit Lorentzian Linear Fit of Data1_B ◆ Fit Multi-peaks 62 008 Non-linear Curve Fit X Ais Title 5 臣山好aA回盈®州同 2 Linear Fit on Datal B Color P 0 45 40 008 0.10 0.120.140.160.18020 0.22024 X Axis Title School of Microelectronics and Solid-State Electronics 28
School of Microelectronics and Solid-State Electronics 28 第五章 回归分析方法

第五章 回归分析方法 f0 riginPro7.5-C:Documents and Settings\Adainistrator\Appl..,.□▣☒ Eile Edit View Graph Data Analysis Tools Format 置indow Help 凸牖鱼凸画@日 ®回蝤园儡C 嘟昌品画回目 至x ▣邱A■回一可旧 目Graphl 日回☒ 图 1 62 Linear Fit of Data1_B 60 cmese.uestc 58 56 ☑eh好Aoa®城回 xLinear Regression for Data1 B: V=A+B米X Parameter Value Error 28.68259 1.56721 132.89946 9.60618 R SD N 0.97486 1.30893 12 <0.0001 Color Publication 1:Datal B(1-12) School of Microelectronics and Solid-State Electronics 29
School of Microelectronics and Solid-State Electronics 29 第五章 回归分析方法

第五章回归分析方法 回归方程是否有意义的判断 在使用回归方程作进一步的分析以前,首先 应对回归方程是否有意义进行判断。 cmese,uestc 三种等价的检验方法 -F检验 -T检验 -r检验 School of Microelectronics and Solid-State Electronics 30
School of Microelectronics and Solid-State Electronics 30 第五章 回归分析方法 回归方程是否有意义的判断 三种等价的检验方法 – F 检验 – T检验 – r检验 在使用回归方程作进一步的分析以前,首先 应对回归方程是否有意义进行判断