Chapter 2 Examining Relationships Between Two Variables 4 Click Multiple Graphs,then click the Seateplet-Hutiale By Variables tab. 5 In By variables with groups in separate panels,enter Center. 6 Click OK in each dialog box. Hrt Graph Scatterplot of Days vs Distance window 12020 04的 output 4 12036 Interpret The points on the scatterplot exhibit no apparent pattern at any of the three centers. results The regression line for each center is relatively flat,suggesting that the proximity of a delivery location to a shipping center does not affect the delivery time. Edit To help your colleagues quickly interpret the scatterplot,you want to add a footnote scatterplot to the plot. 1 Click the scatterplot to make it active. 2 Choose Editor Add Footnote. Pdienhp beln dlvyue aed ddareshn ping trte 3 In Footnote,type Relationship between delivery time and distance from shipping center. 4 Click OK. 默☐cw 2-10 Meet MINITAB
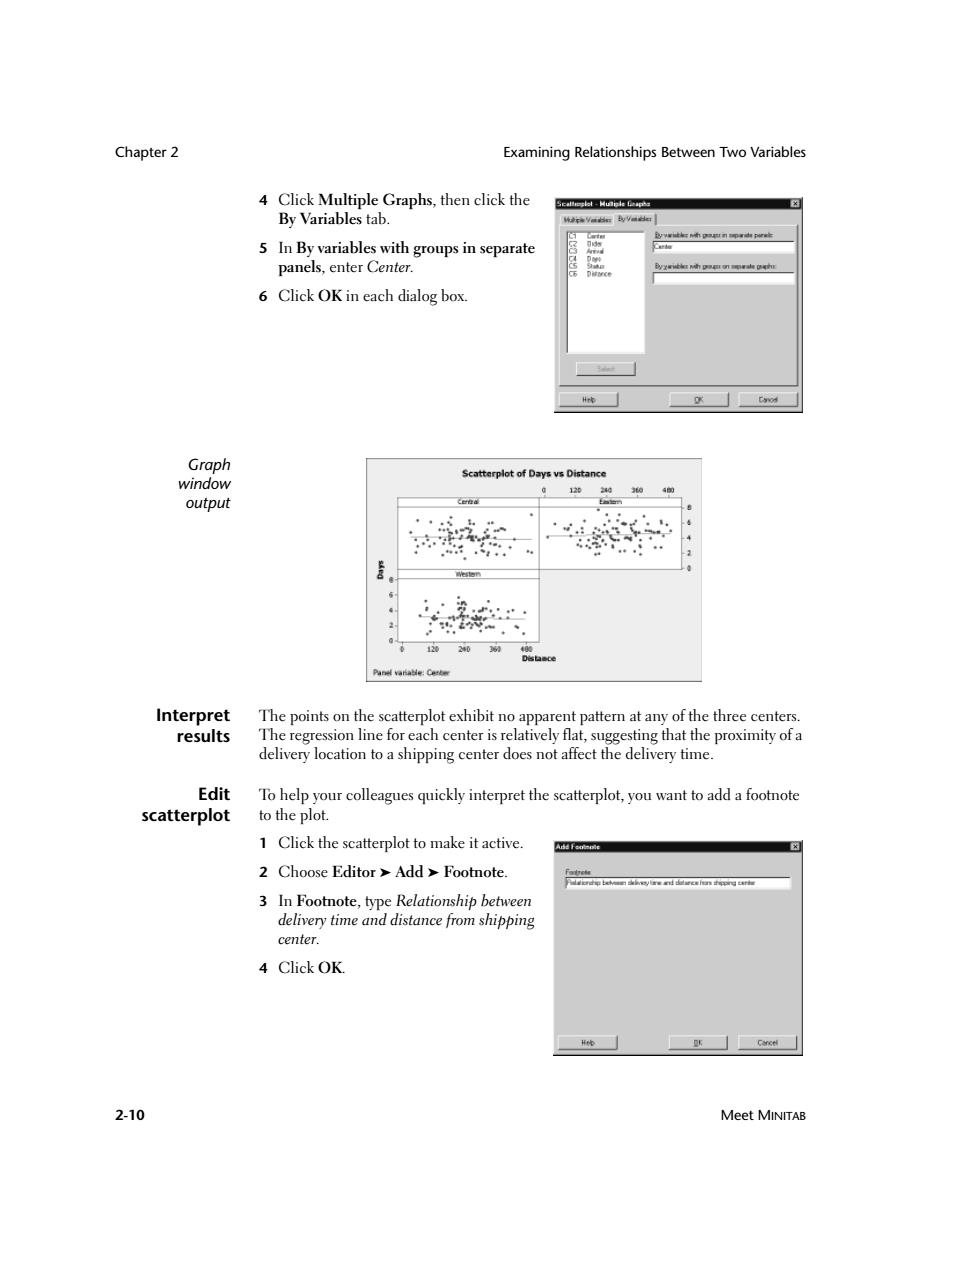
Chapter 2 Examining Relationships Between Two Variables 2-10 Meet MINITAB 4 Click Multiple Graphs, then click the By Variables tab. 5 In By variables with groups in separate panels, enter Center. 6 Click OK in each dialog box. Graph window output Interpret results The points on the scatterplot exhibit no apparent pattern at any of the three centers. The regression line for each center is relatively flat, suggesting that the proximity of a delivery location to a shipping center does not affect the delivery time. Edit scatterplot To help your colleagues quickly interpret the scatterplot, you want to add a footnote to the plot. 1 Click the scatterplot to make it active. 2 Choose Editor ➤ Add ➤ Footnote. 3 In Footnote, type Relationship between delivery time and distance from shipping center. 4 Click OK
Using Graph Layout and Printing Graphing Data Graph window Scatterplot of Days vs Distance 04侧 output 2024036 Panel varable:Center Interpret The scatterplot now features a footnote that provides a brief interpretation of the results results. Using Graph Layout and Printing Use MINTTAB's graph layout tool to place multiple graphs on the same page.You can add annotations to the layout and edit the individual graphs within the layout. To show your supervisor the preliminary results of the graphical analysis of the shipping data,display all four graphs on one page When you issue a MINITAB command that you previously used in the same session,MINITAB remembers the dialog box settings.To set a dialog box back to its defaults,press F3. Meet MINITAB 2-11
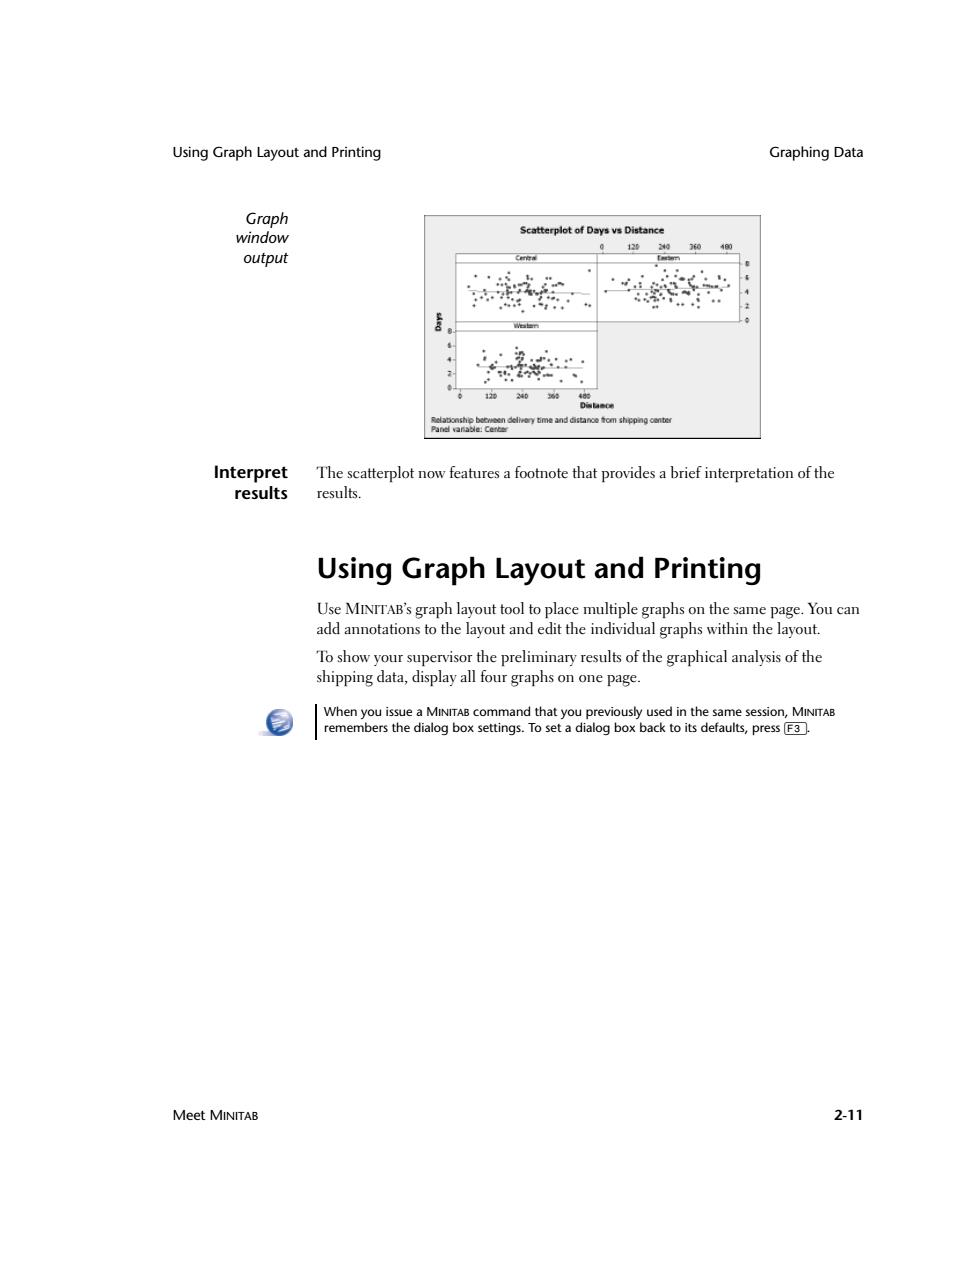
Using Graph Layout and Printing Graphing Data Meet MINITAB 2-11 Graph window output Interpret results The scatterplot now features a footnote that provides a brief interpretation of the results. Using Graph Layout and Printing Use MINITAB’s graph layout tool to place multiple graphs on the same page. You can add annotations to the layout and edit the individual graphs within the layout. To show your supervisor the preliminary results of the graphical analysis of the shipping data, display all four graphs on one page. When you issue a MINITAB command that you previously used in the same session, MINITAB remembers the dialog box settings. To set a dialog box back to its defaults, press 3
Chapter 2 Using Graph Layout and Printing Create graph 1 With the scatterplot active,choose Editor Layout Tool.The active graph,the layout scatterplot,is already included in the layout. A list of all open graphs Buttons used to move graphs to and from the layout The next graph to be moved to the layout 2 Click the scatterplot and drag it to the bottom right corner of the layout. 3 Clickto place the individual value plot in the upper-left comner of the layout. 4 Clickto place the grouped histogram in the upper-right comer. 5 Clickto place the paneled histogram in the lower-left corner. 6 Click Finish】 Graph iterad Dutary Dre window output : If the worksheet data change after you create a layout,MINITAB does not automatically update the graphs in the layout.You must re-create the layout with the updated individual graphs. 2-12 Meet MINITAB
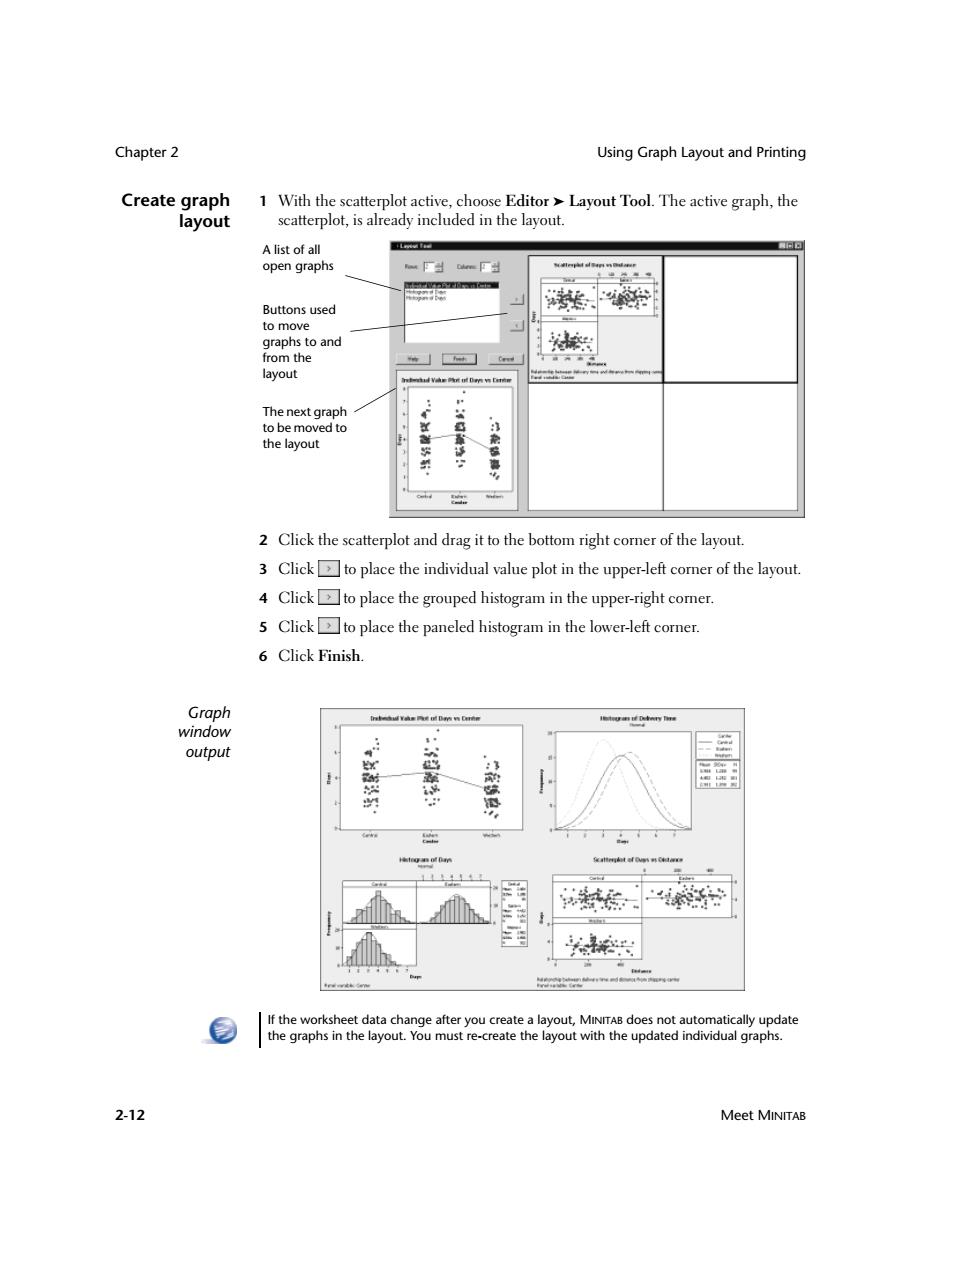
Chapter 2 Using Graph Layout and Printing 2-12 Meet MINITAB Create graph layout 1 With the scatterplot active, choose Editor ➤ Layout Tool. The active graph, the scatterplot, is already included in the layout. 2 Click the scatterplot and drag it to the bottom right corner of the layout. 3 Click to place the individual value plot in the upper-left corner of the layout. 4 Click to place the grouped histogram in the upper-right corner. 5 Click to place the paneled histogram in the lower-left corner. 6 Click Finish. Graph window output A list of all open graphs Buttons used to move graphs to and from the layout The next graph to be moved to the layout If the worksheet data change after you create a layout, MINITAB does not automatically update the graphs in the layout. You must re-create the layout with the updated individual graphs
Saving Projects Graphing Data Annotate the You want to add a descriptive title to the layout. layout 1 Choose Editor Add Title. 2 In Title,type Graphical Analysis of Shipping Center Data.Click OK. Graph Graphical Analysis of Shipping Center Data window output 前 梦 招时 Print graph You can print an individual graph or a layout just as you would any other MINITAB layout window. 1 Click the Graph window to make it active,then choose File Print Graph. 2 Click OK. Saving Projects MINTTAB data are saved in worksheets.You can also save MINTTAB projects which can contain multiple worksheets.A MINITAB project contains all your work,including the data,Session window output,graphs,history of your session,ReportPad contents, and dialog box settings.When you open a project,you can resume working where you left off. Meet MINITAB 2-13
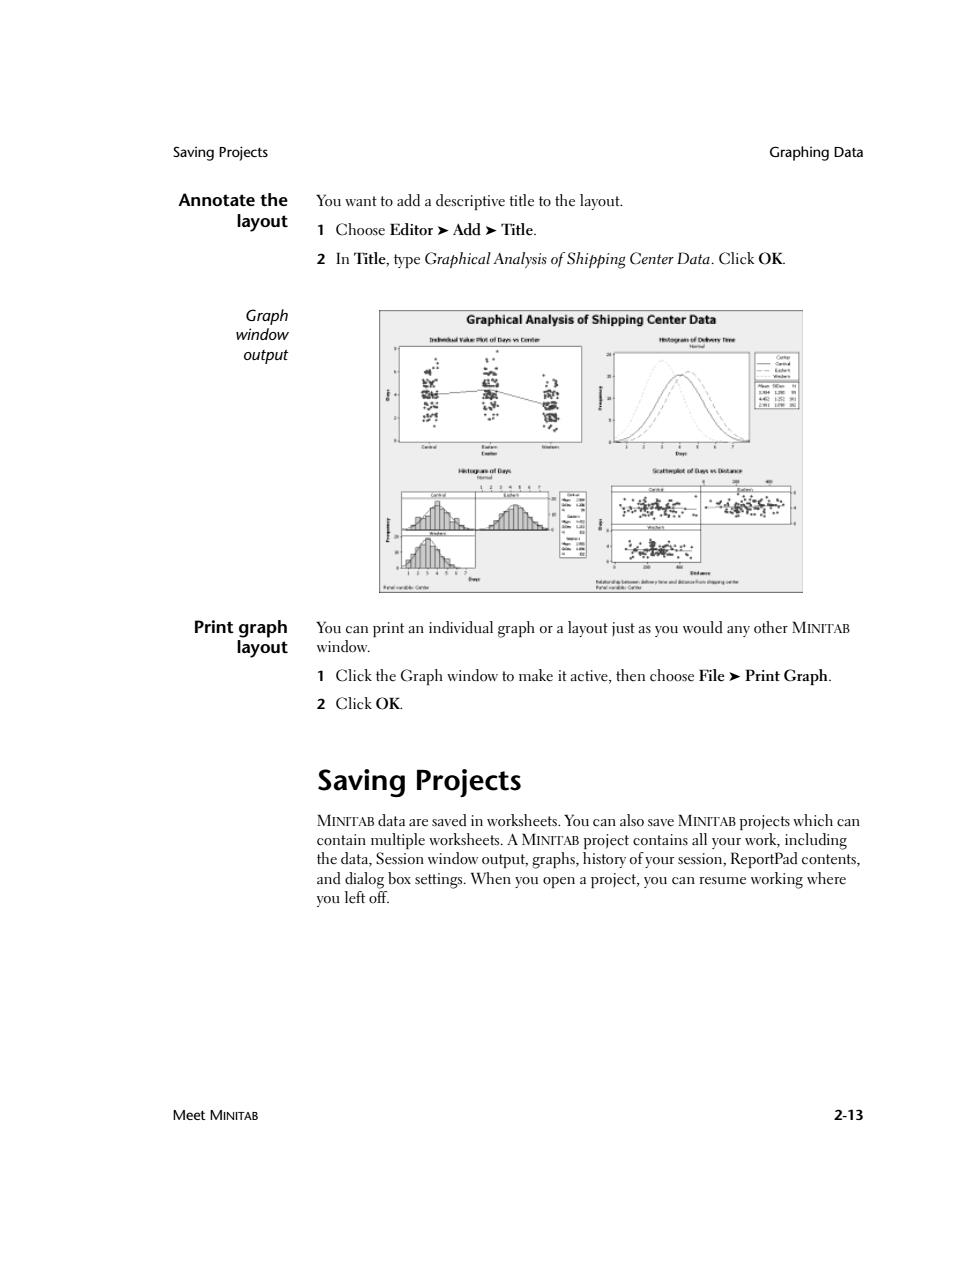
Saving Projects Graphing Data Meet MINITAB 2-13 Annotate the layout You want to add a descriptive title to the layout. 1 Choose Editor ➤ Add ➤ Title. 2 In Title, type Graphical Analysis of Shipping Center Data. Click OK. Graph window output Print graph layout You can print an individual graph or a layout just as you would any other MINITAB window. 1 Click the Graph window to make it active, then choose File ➤ Print Graph. 2 Click OK. Saving Projects MINITAB data are saved in worksheets. You can also save MINITAB projects which can contain multiple worksheets. A MINITAB project contains all your work, including the data, Session window output, graphs, history of your session, ReportPad contents, and dialog box settings. When you open a project, you can resume working where you left off
Chapter 2 What Next Save a Save all of your work in a MINTTAB project. MINITAB 1 Choose File Save Project 口☒ project As. 习中四廿团 2 In File name,type 习 MY GRAPHS.MPI. 0 MINITAB automatically adds the extension.MP]to the file name when you save the project. NY GRAPHS MPS 3 Click Save. 5¥60 Derggtmn If you close a project before saving it,MINITAB prompts you to save the project. What Next The graphical output indicates that the three shipping centers have different delivery times for book orders.In the next chapter,you display descriptive statistics and perform an analysis of variance(ANOVA)to test whether the differences among the shipping centers are statistically significant. 2-14 Meet MINITAB
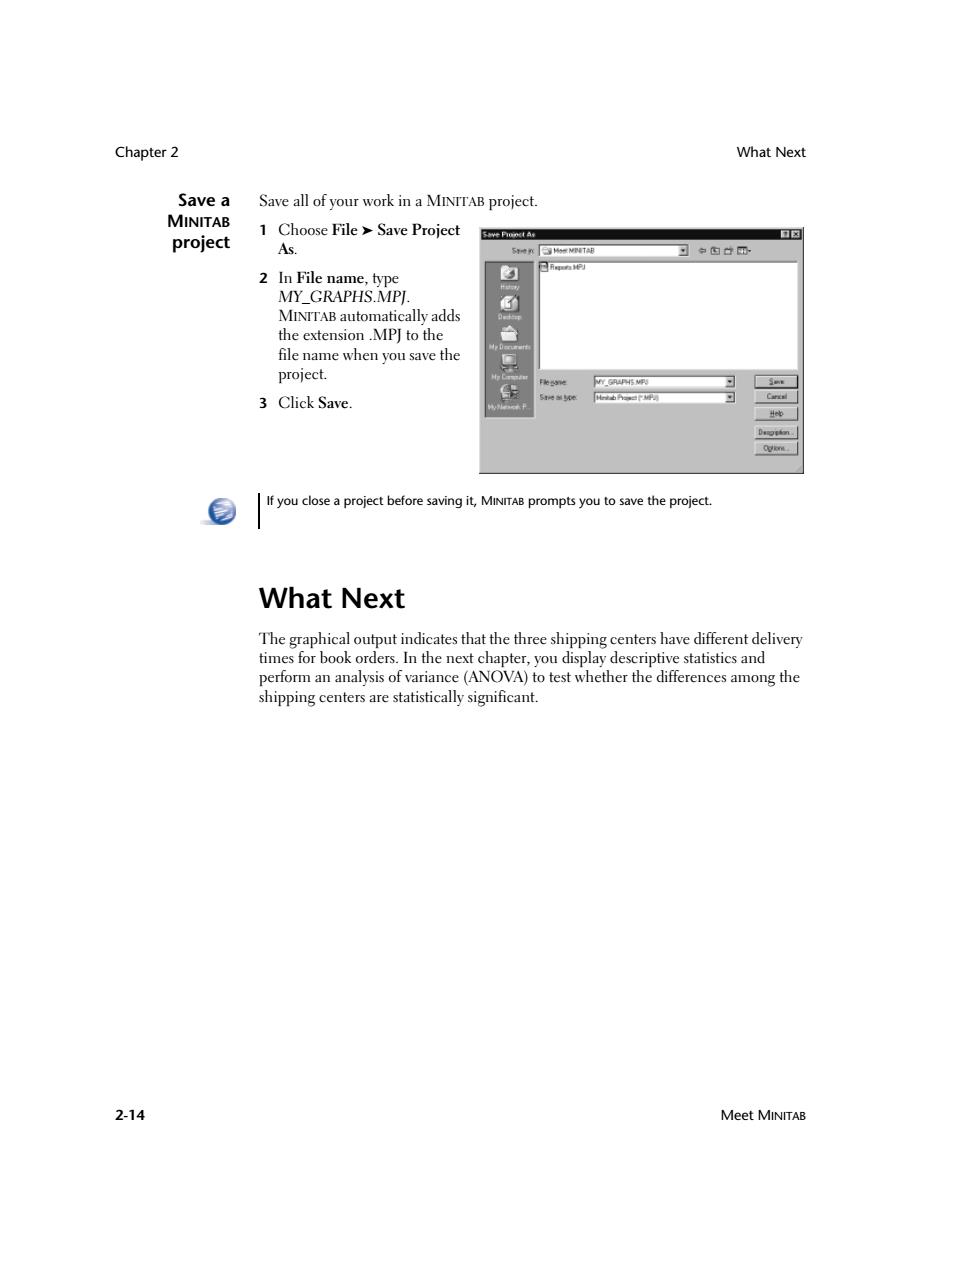
Chapter 2 What Next 2-14 Meet MINITAB Save a MINITAB project Save all of your work in a MINITAB project. 1 Choose File ➤ Save Project As. 2 In File name, type MY_GRAPHS.MPJ. MINITAB automatically adds the extension .MPJ to the file name when you save the project. 3 Click Save. What Next The graphical output indicates that the three shipping centers have different delivery times for book orders. In the next chapter, you display descriptive statistics and perform an analysis of variance (ANOVA) to test whether the differences among the shipping centers are statistically significant. If you close a project before saving it, MINITAB prompts you to save the project