
Titration of an amino acid.Shown here is the titration curve of 0.1 M glycine at 25C.The ionic species pre- dominating at key points in the titration are shown above the graph.The shaded boxes,centered at about pKi 2.34 and pK2 =9.60,indicate the regions of greatest buffering power. NHs H NH2 CH2 CH2 CH2 COOH C00- C00 13 Glycine pK2=9.60 pH pI=5.97 pK1=2.34 0 0.5 1 1.5 2 OH-(equivalents)
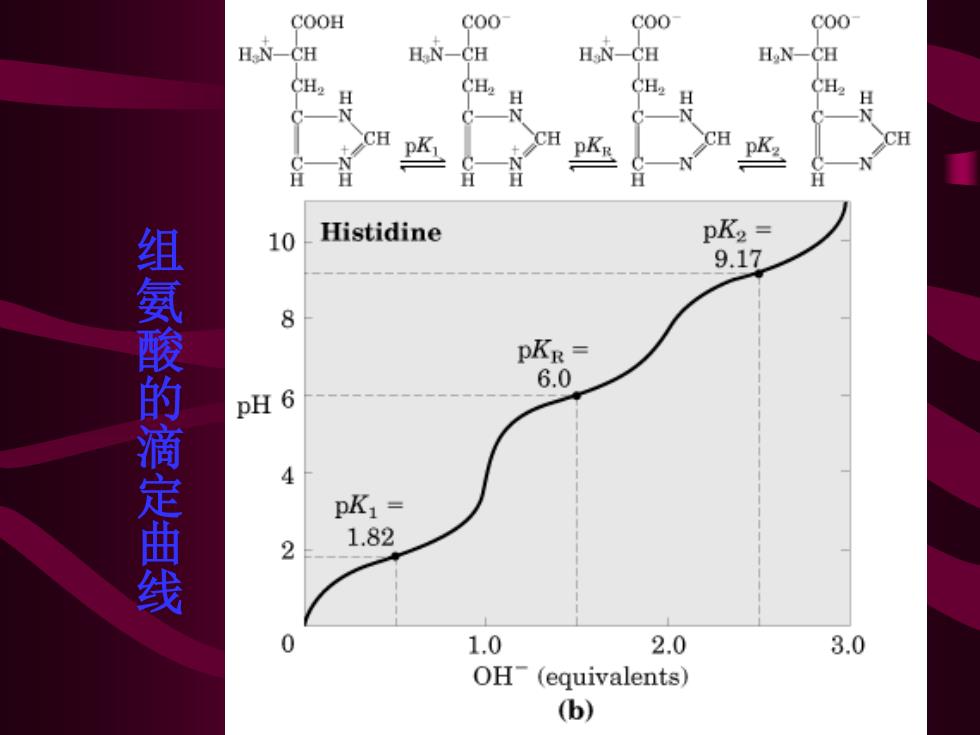
COOH C00 C00 C00 H N-CH H N-CH HN-CH H N-CH CH2 CH2 CH2 N -N CH CH CH CH N H H H 10 Histidine pK2= 9.17 组氨酸的滴定曲线 8 pKR= 6.0 pH 6 4 pK1= 2 1.82 0 1.0 2.0 3.0 OH(equivalents) (b)
组氨酸的滴定曲线