
:Jan 199.1:ABI/NFORM Global Survey of Software with Mixture Experiment Capabilities GREGORY F.PIEPEL Battelle.Pacific Northwest Laboratories.Richland.WA 99352 total of 5ack litie ture ex mer analysis capa os)are smmarized in table form.Mailing addr and faxnumbers of the software vendors are also provide Introduction The dor in three taband were provided to the A two of the s paper.The three tables and their contents are dis Othe amount of the mixtur cussed in the next section. or pr rocess variables (nonmix It was b nd the of my ec software package.or to loo nd gather inform software having mixture ex. rience with several of the sofware packages.andI maires and asked to indicat whether or not their software had 【or des1gI rative mixtur mation about types of li problems with the Performing compar ative review are er e After receiving the vendors'respo es to the ques that ntere the vend or contact was th capahilities they need. To make intormatio Journal of Quality Technology Vol.29.No.1.January 1997 Reproduced with permission of the copyright owner.Further reproduction prohibited without permission
Reproduced with permission of the copyright owner. Further reproduction prohibited without permission. Survey of software with mixture experiment capabilities Piepel, Gregory F Journal of Quality Technology; Jan 1997; 29, 1; ABI/INFORM Global pg. 76
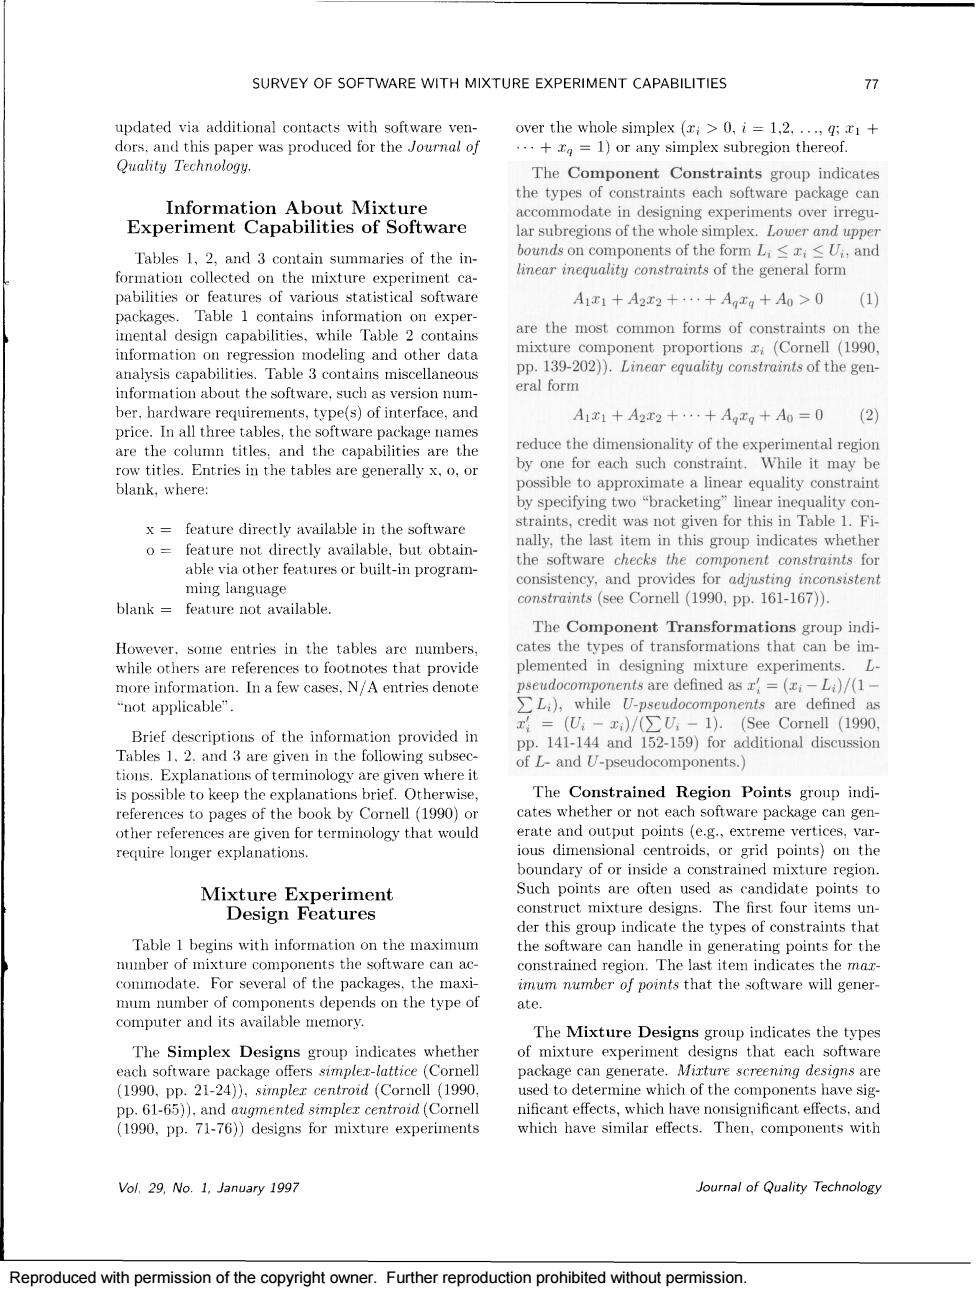
SURVEY OF SOFTWARE WITH MIXTURE EXPERIMENT CAPABILITIES n over the whole simplex (>0=1.2. Quality Technology. Infor accommodate in designing experiments over irregu- pab tware of th Tables 1.2,and 3 contain summaries of the in- linear constrints of the general form A1+A22++Axg+A0>0 (1 able ins inf imental design capabilities,while Table 2 contain are the most common forms of constraints on th mixture component proportions (Cornell (1990. inforntioneraionenodeigandotherdaa ber,hardware thesoferface,and A11+A22+.+Agg+A0=0 e blank.where: lity cor feature n Table ailable but obtain the software checs the con ming language consistency.and provides blank feature not available The component Transformations g However.some entries in the tables are ubers cates the types of transformations that can be im while others are references to footnotes that provide while U-pseudoco -1).(See Cornell (1990. Brief descriptions of the information provided in of ter The Constrained Region Points group indi references to pages of the book by Cornell (1990)o rguielougereaonrtemmobgthaLol cates whether or not each software package can gen- potnts (e.g.,extreme ve boundary of or inside a constrained mixture region an Such points s are often used s candidate points to der this group indicate the te the software can handle in generating points for the recoTnpoeh are can ac m number of comp computer and its available memory. The Mixture Designs group indicates the type (1990.pp.21-24)).simpler centroid (Cornell (1990 which of the have sig Vol.29,No.1.January 1997 Joumal of Quality Technology Reproduced with permission of the copyright owner.Further reproduction prohibited without permission
Reproduced with permission of the copyright owner. Further reproduction prohibited without permission
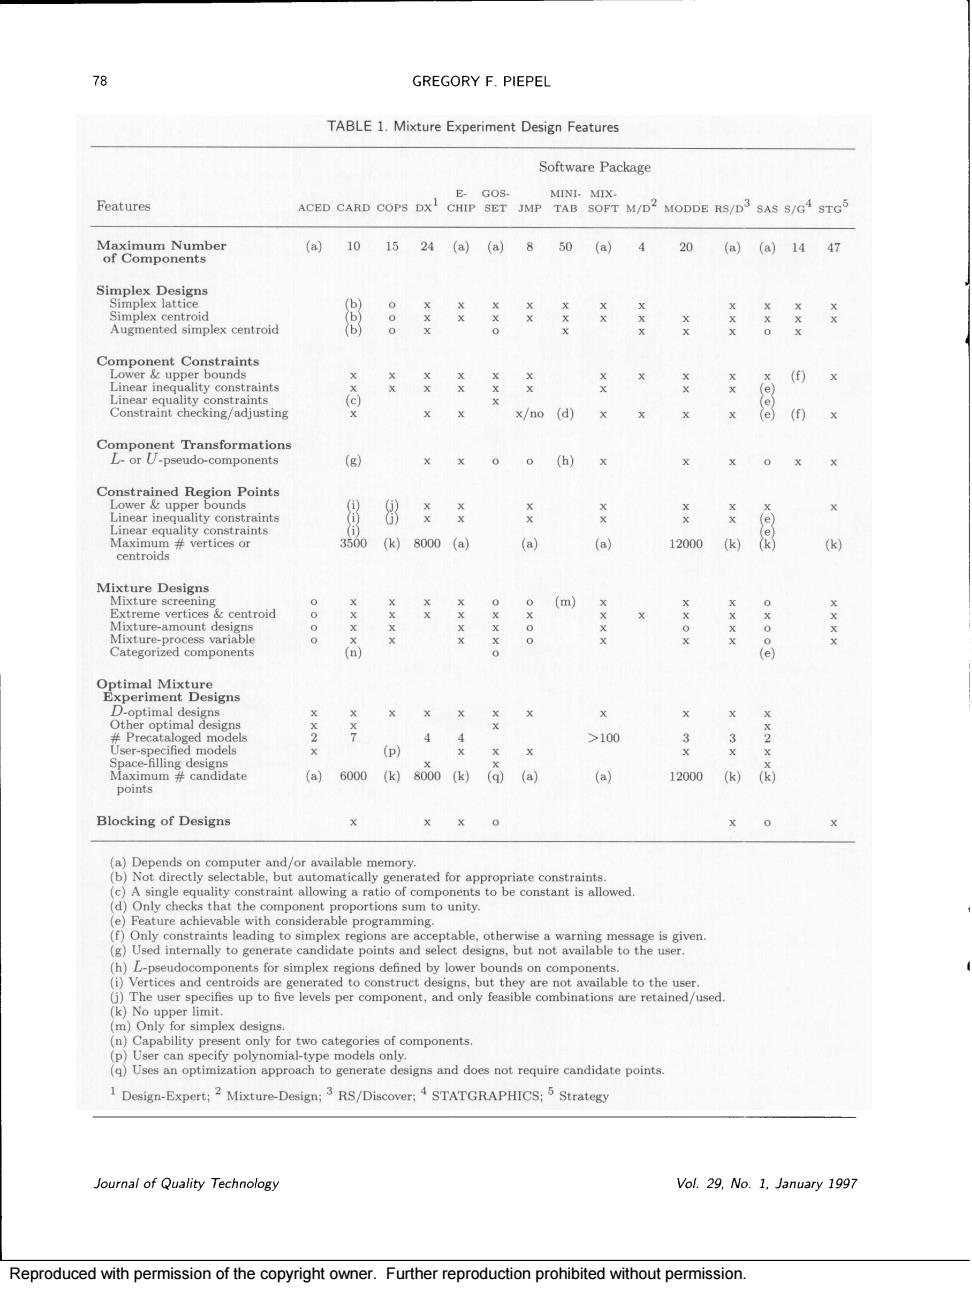
GREGORY F.PIEPEL TABLE 1.Mixture Experiment Design Features Software Package Features ACED CARD COPS DXI CHIP SET JMP TAB SOFT M/D2 MODDE RS/D SAS S/G STGS eampoiaeabe (a)101524(a)(a850(a)420a)a1447 Simplex De 之8。 xx B 8 38065000(a (a) 12000k8 K2 >100 3 idat (a)6000ss000国aa (a) 12000k)G Blocking of Designs xx o ponent pr ple ned by sand do not r ndidate point Design-Expert;Mixture-Design;RS/Discover:STATGRAPHICS;Strategy Quality Technology Vol.9,No.1.January 1997 Reproduced with permission of the copyright owner.Further reproduction prohibited without permission
Reproduced with permission of the copyright owner. Further reproduction prohibited without permission

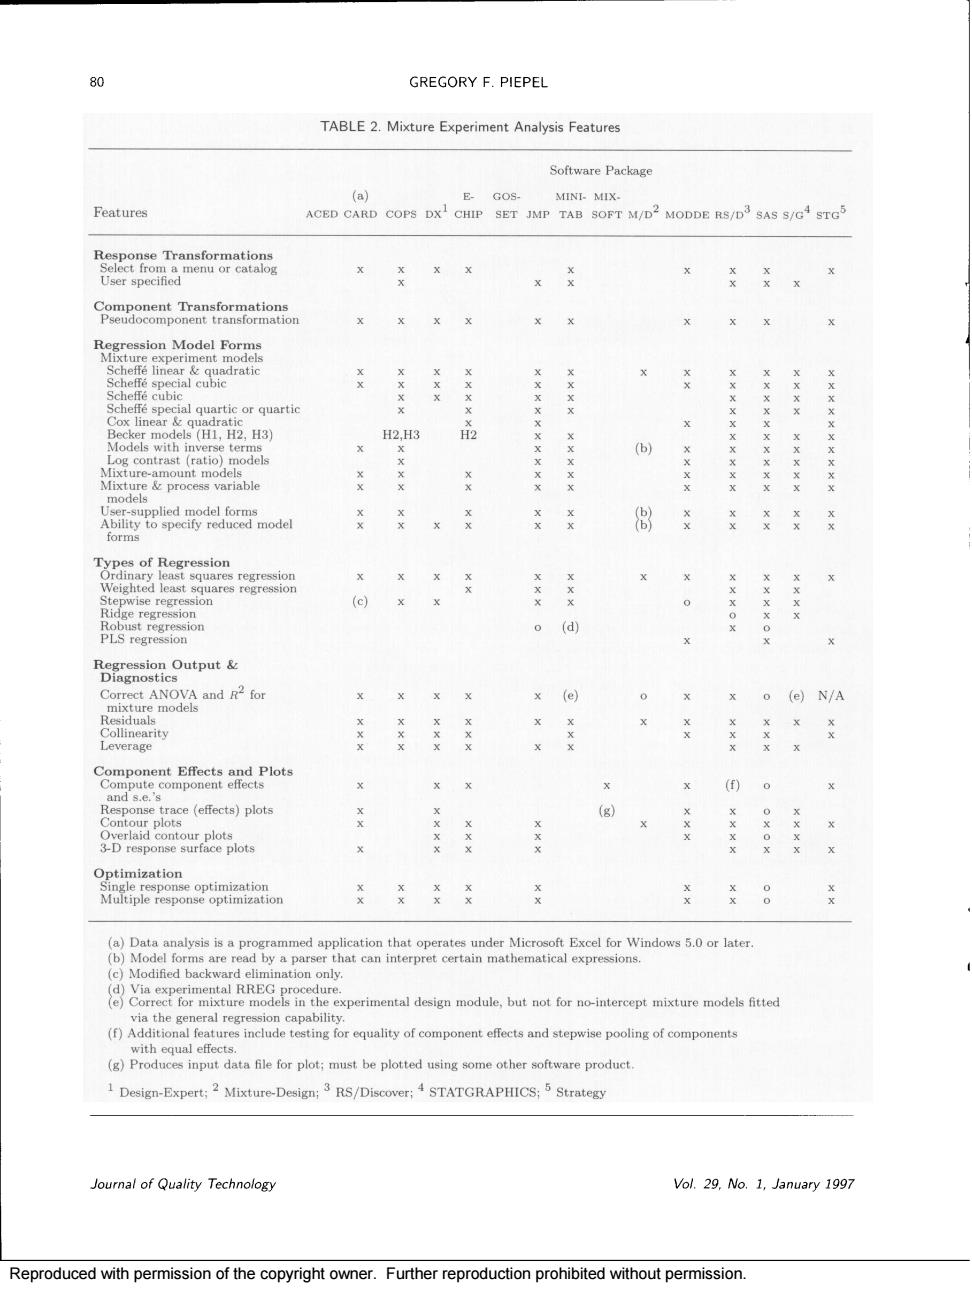
SURVEY OF SOFTWARE WITH MIXTURE EXPERIMENT CAPABILITIES 79 Mixture Ex eriment Analysis Features only a few more design points than the number of SET focus completel on experimental design.while mixturecom eing screene Hence This centroids of a constrained mixture the blank spaces in Table 2 for these packages. are applica nd a tions the responsefs)of interest (see Cornell (1990.section ity to transform the response variable(s)before mod- eling or other data analyses.Some software packages while othe s well as the mixture components (sce Cornell (1990 tions (usually via a built-in programming language). omponent designs The Compon mixture of two r more components (see Cornell mixture components to L-or U-pseudocomponents (1990,Pp.205-220) In some package this ca in programming language The Optimal Mixture Experiment Designs group indicates the capabilities of each software The Regression Model Forms group indicates or g cring sta that sa the types of re on mode ify.for experiments invoving mixture components nonmixture variable 465) optimal desie and software are model-driven,and require the user listed.See Cornell ()for to specify a model form Hence,there pp,24-27) 290296.and m(i.e.lists/menus of models users may pic log contrast models (pp.325-332 The next two om)while others allow for us in the group indicate whet in which the total amount of the mixture quire specifying a model form.Rathe .space-filling erperiments)or the levels of process designs try to fill he experimenta (1990. 407-41d.Not that models for a mixture experiment with one pro son,Moore,and Ylvisaker (1990)).The final item ir cess variabl an be used mixture-amoun e group indicates th side ating an optimal experimental design. zero value (Piepel (1988)). The last two items in he group indicate e whether provides fo ities for blocking experimental designs (see Cornell (1990.pp.436-451) Vol.29.No.1,January 1997 Journal of Quality Technology Reproduced with permission of the copyright owner.Further reproduction prohibited without permission
Reproduced with permission of the copyright owner. Further reproduction prohibited without permission
GREGORY F.PIEPEL TABLE 2.Mixture Experiment Analysis Feature Software Packag Features M/D2 MODDE RS/D SAS/TG Gpnm28asmtTranfarmoioio xXxx XX XX al quartic or quarti H2,H3 H2 mll B rergreio Xx Output xxxx x (e) 0 XX 0。 e (effects)plots (¥ eoptimi7atio n erimental design module.but not for no-intercent mixture models fitted einclude teting component effect and stepwise pooling of (g)Produces input data file for plot:must be plotted using someother oftware product Design-Expert:Mixture-Deign:RS/Discover:STATGRAPHICS;Strateg Joumal of Quality Technology Vol.29.No.1.January1997 Reproduced with permission of the copyright owner.Further reproduction prohibited without permission
Reproduced with permission of the copyright owner. Further reproduction prohibited without permission