Control Charts Applying a Sequential Test at Fixed Sampling Intervals ZACHARY G.STOUMBOS Rutgers,The State University of New Jersey.Newark.NJ07102-189 MARION R.REYNOLDS,JR. Virginia Polytechnic Institute and State University,Blacksburg.VA 24061-0499 chart d which var s the sampling rate at sampling points function charts and other variable samling rate versions of these charts.Guidelines are given for the desig of the proposed chart. Introduction cha sobserved from the process. Tha is,after a sam tive of detecting any change in a process that m e next sample practice is to take samples() process chang For example,l an F5 trol chart,however,car of the proc S W n orde lcmRieaedforxape nd A ces change.then the sampling rate should be low. tel(1990),Reynolds. and Arnold (1990) nger and Pi Several approaches to varving the sampling rate tiello(1991 993.R ,(1993),Stoumbos(1993 PTab ger (eynods Operations Research (RUT. earch on VSI charts has shown that on averag charts are matched to have the am average sam- Vol.29.No.1.January 1997 21 Reproduced with permission of the copyright owner.Further reproduction prohibited without permission
Reproduced with permission of the copyright owner. Further reproduction prohibited without permission. Control charts applying a sequential test at fixed sampling intervals Stoumbos, Zachary G; Reynolds, Marion R Jr Journal of Quality Technology; Jan 1997; 29, 1; ABI/INFORM Global pg. 21
22 ZACHARY G STOUMBOS AND MARION R REYNOLDS IR pling rate and the same average frequency of false probability ratio test (SPRT)chart,defined as a se A dis charts that the qence of SPRT unpredictable,and these sampling points may not is on targt correspond I periods in the process,such the mean is not on target.The time interval d as work s or th amount T's(from raw materials.The disadvantage of unpredictabl is a sequential hypothesis test.and for the be tak samples allowed between these fixed times when nec pendix A. (1993).Baxley(1995).and tion for the SPRT Another a be tested in a very short (negligible)time using a case every hot the he r,fo the pro That is after a sample is taken the ald be size of the n mple shoud e is a ll if th sured one resistor at a time. cdcaoofap applying an SPRT for an FSS chart for a certain application takes samples If ing th the be SPRT of 5 ob vations,then a Schart for this applica null hypothesis that the mean resistance is on tar. get. anothe one hou Sawalapurkar-Powers.Reynolds,and Arnold (1990) D.L 199 s(1).Costa signal that corrective action shoud be taken. this example,d is one hour. and Runger (1994).Reynolds (1996b),and Stoum vit h bos and Reynolds(1996b. 1996c).A VSS chart has oli nte tim can a VSS chart in the usual sense.In a VSS chart,the has shown that, current sampl mine on av age.the VSS feature will ubstantially FSS ch the current sampling point depends on the data o amp erage sampling rate and the same average frequenc the ysst ontrol charts is given in the ditional reduction in the ave nex ection time of section.Note that Daudin(1992)proposed the ingthe m at FSI's based on data from the current sampling The purpose of this paper is to provide an FSI point This chart assumes that two successive sam procedure for monitoring the me pr 91 and n2.resp can b time to tae an individual observation is The double sampling chart varies the sample size time at each sampling point be ween two pr short that it can be neglected. The idea is to var in zero sample s ly at ea the SPRT chart the sa size can be integer. pling point.by sampling sequentially one observatio at a time.Hence,this paper develops the sequential The SPRT chart is especially appropriare for ap- Journal of Quality Technology Vol.29,No.1.January 1997 Reproduced with permission of the copyright owner.Further reproduction prohibited without permission
Reproduced with permission of the copyright owner. Further reproduction prohibited without permission
CONTROL CHARTS APPLYING A SEQUENTIAL TEST AT FIXED SAMPLING INTERVALS plications where testing is destructive and /or expen 1.2 Each sample (X. .X.is assumed t such as in deployment-rate testing of autome be taken in negligible time.Assume that the process 0.but no observation s It should be noted that a deploved airbag is not pling interval between observations X reusable and airbags are costly.Also onote that the will be d requ ag I deploy for/P and o That is,d is the een samp to the int the sampling times,which are usually no more of ation of from o in terms of units of and let In such practical Assume that observations within siAt nport of the The organization of the remainder of this eresidd is as follow A description of the SPRT char +上(2-以.ii=1 compared to the standard and CUSUM charts and VSI feature Uy= (1 to the when th 5 an ar f1=23 that the SPRT chart i than both the X and CUSUM charts,even when VSS for i=1. N.where uo 0.h denotes the and/or Then,gud specified starting value of the control statistic,and tive example is provided.In Appendix A,the defini- he tion of an SPRT for the mean of a normal variable rom a constant multiple)in the SPRT for testing the ties of the sprt char are developed in Appendix Bin terms of integral o versusH:=o 270,where each SPRT is equations gible time.with The SPRT Chart 1 abhewehetXrepn ng the observations from sample (A, its te that if SPRT chart is defined to e,et a target value uo (i)stop sampling and signal if U.h: the case will be considered here where shifts from otoand stays at he shi ) andor from past data,but for simplicity,it will be assumed here that go and 2 are known. e SPRT's dise per one-sided SPRT chart see Figure la.where.fo utive satules (X. urPposesofYisual arity,the tim of observations taken sequen atively large. 1+2 el where N.denotes the num Similarly.let the coutrol statistic of the lowerone ber of observations in sample )for i= sided SPRT chart for detecting a decrease in u be Vol.29.No.1.January 1997 Quality Technolog Reproduced with permission of the copyright owner.Further reproduction prohibited without permission
Reproduced with permission of the copyright owner. Further reproduction prohibited without permission
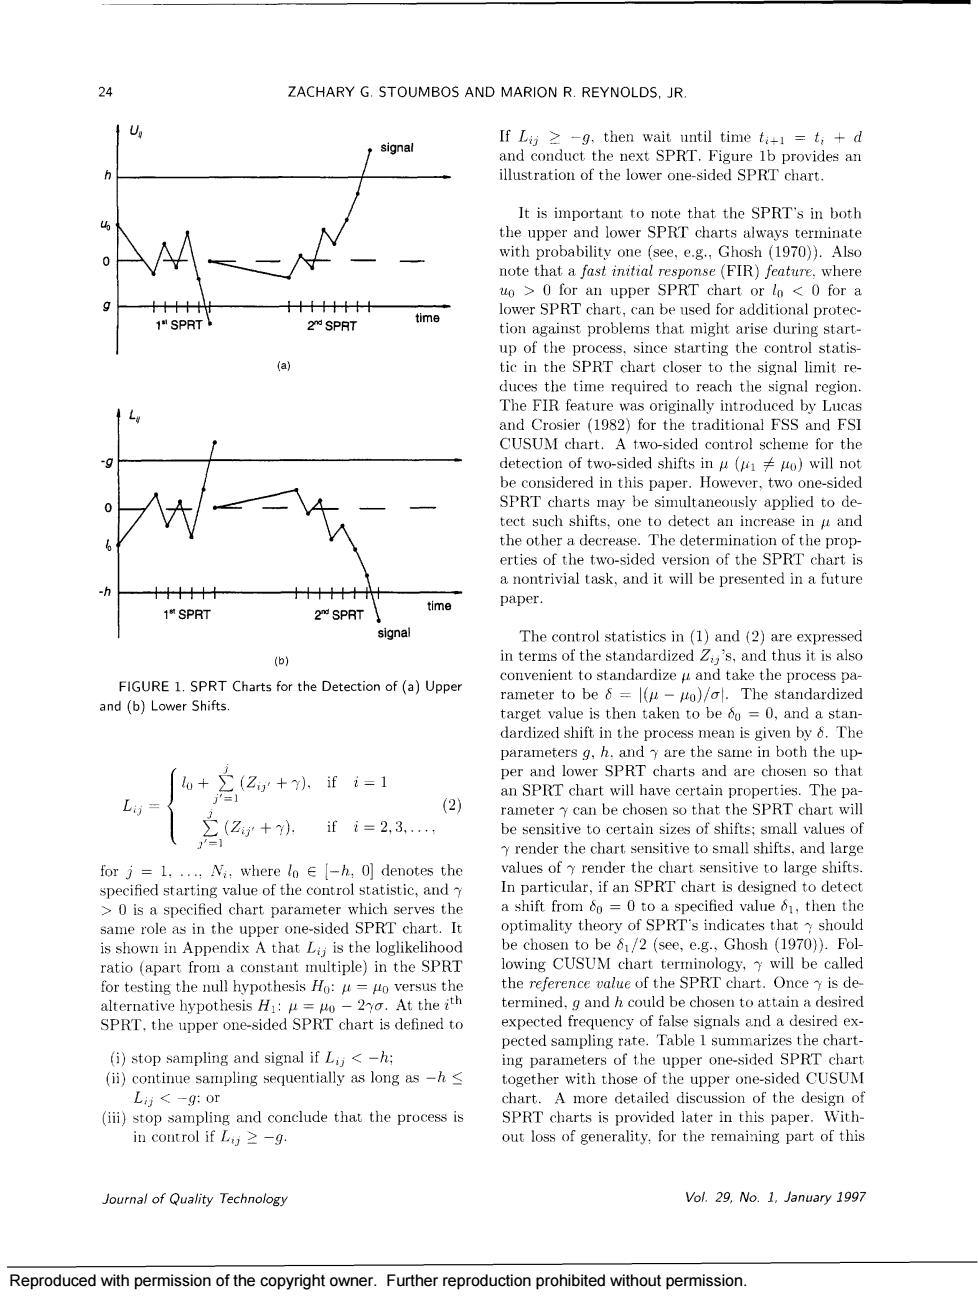
24 ZACHARY G.STOUMBOS AND MARION R.REYNOLDS,JR. If Lg z-9.then wait until timet=t;+d signal It is important to note that the SPRT's in both the upper SPRT char uo>0 for an upper SPRT chart or lo <0 for a time up of the process.since starting the control statis tie in the SPRT chart closer to the signal limitre by Luc and Crosier(1982)for the traditional FSS and FS OM chart. r th be considered in this paper.However two one-sided SPRT charts may be simultaneously applied to de erties of the two-sided version of the SPRT chart is a nontrivial task,and it will be presented in a future 1"SPRT time paper 2 SPRT The control statistics in (1)and (2)are expressed tb) rameter to be&=μ- o)l.The standardized (2 The pa ,(2+ii=2.3. y render the chart sensitive to small shifts.and large N,where lo [h,0]denotes the alues of sen a shift from 6o =0 to a ecified value 6 then the optimality theory of SPRT's indic tha is shown in Appendix A that L is the loglikelil e ch CUSUM chart (see,e.g 1 iple)n the S the reference value of the SPRT chart.Once is de alternative bypotbesis= 20.At the ith be chosen to attaina desire SPRT.the upper one-sided SPRT chart is defined to (i)stop sampling and signal ifh ther witn upper one SPRT charts is provided later in this paper.With in coutrol ifa >-g. out loss of generality.for the remaining part of this ournal of Quality Technolog Vol.29.No.1.January 1997 Reproduced with permission of the copyright owner.Further reproduction prohibited without permission
Reproduced with permission of the copyright owner. Further reproduction prohibited without permission
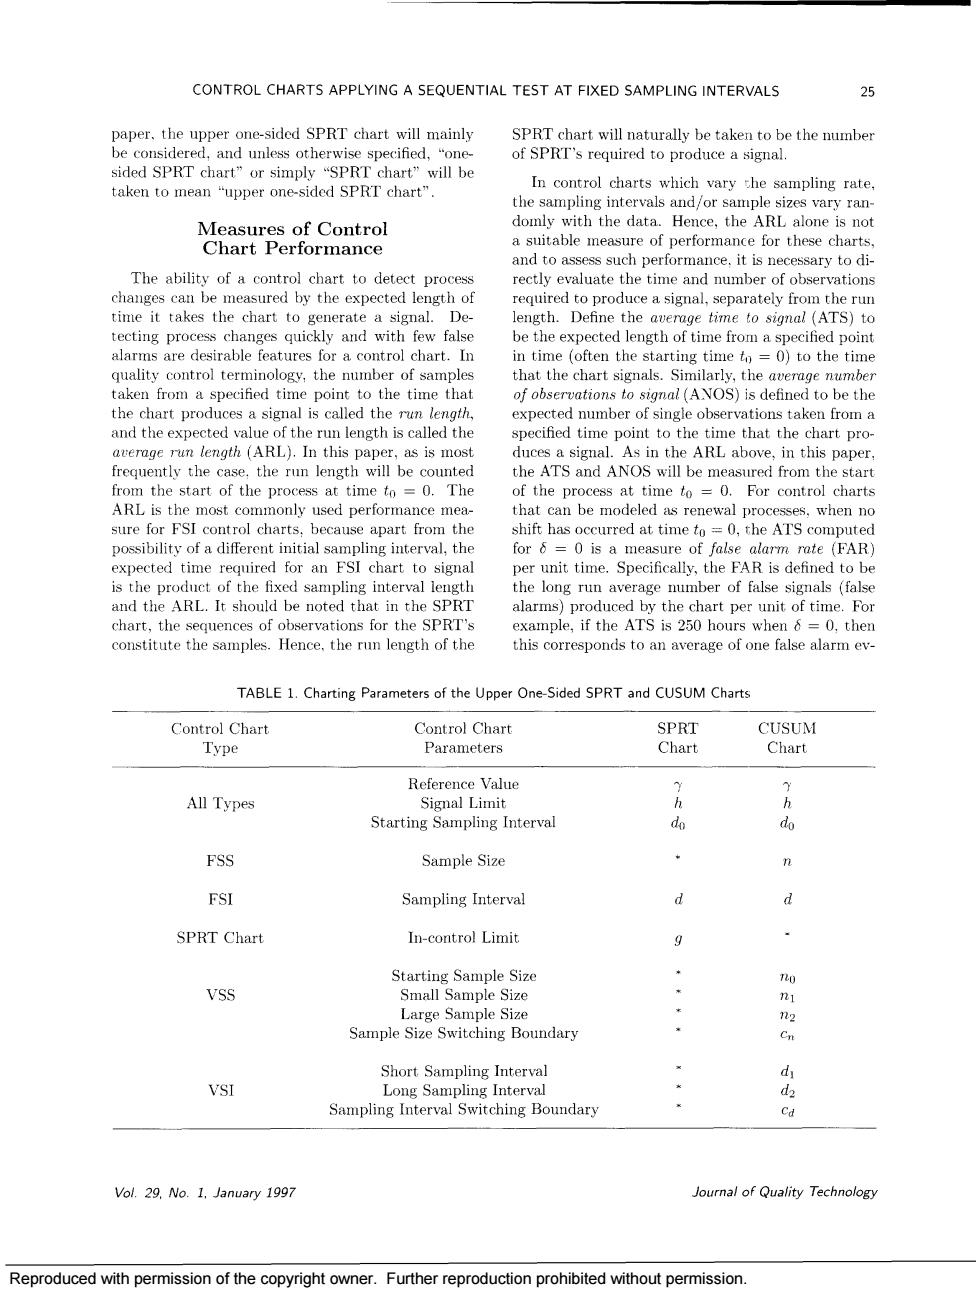
CONTROL CHARTS APPLYING A SEQUENTIAL TEST AT FIXED SAMPLING INTERVALS SPRT chart will naturally be taken to be the number of SPRT's required to produce a signal. domly with the data.Hence,the ARL alone is not a sitable measure of performance for these chart The ability of a control chart to detect process rectly evaluate the time and number of observations measured by the expected length of d en to sign alarms are desirable features for a control chart.In o=0)to the tim hat the chart arly.th verage num cted number of single observa and the expected value of the run length is called the specified time point to the time that the chart pro 1 n this paper ARL above,i this pape from the start of the process at time.The f the process at time to=o For control charts hat t init apa expected time required for an FSI chart to signal unit time.Specifically,the FAR is defined to be rt,for the SPRI =0 ther constitute the samples.Hence.the run length of the this corresponds to an average of one false alarm ev TABLE 1.Cha ng para eter s of the Upper One-Sided SPRT and CUSUM Charts m CUSUM Chart Reference value All Types Signal Limit Starting Sampling Interval do do FSS Sample Size FSI Sampling Interval SPRT Chart In-control Limit VSS .: Short Sampling Interval d VSI Vol.29.No.1.January 1997 Journal of Quality Technology Reproduced with permission of the copyright owner.Further reproduction prohibited without permission
Reproduced with permission of the copyright owner. Further reproduction prohibited without permission