iofQuality Techmology:Jan 1997.9.1:ABI/INFORM Global A Unifying approach to Process Capability Indices FRED A.SPIRING University of Manitoba,Winnipeg,MB.Canada R3T2N2 Much contr 2aocadwhtenosndsmsygheegoecp Introduction In an attempt to simplify matters that have led gether while illustrating some of the statistical prop eralinpetus behind the s Kotz.and Johnson (1992)are developed and partic cused in the context of this uni the of statistical control and the The mnost common class of pr cess capability mea and tio.The ratio comparisons drawn acr spe to this cla of measures and is defined to be the rati For example,the proces C USL LSL nost cormon measure Cfails totake es of C Because t process sprea Vol.29.No.1.January 1997 Journal of Quality Technology Reproduced with permission of the copyright owner.Further reproduction prohibited without permission
Reproduced with permission of the copyright owner. Further reproduction prohibited without permission. A unifying approach to process capability indices Spiring, Fred A Journal of Quality Technology; Jan 1997; 29, 1; ABI/INFORM Global pg. 49

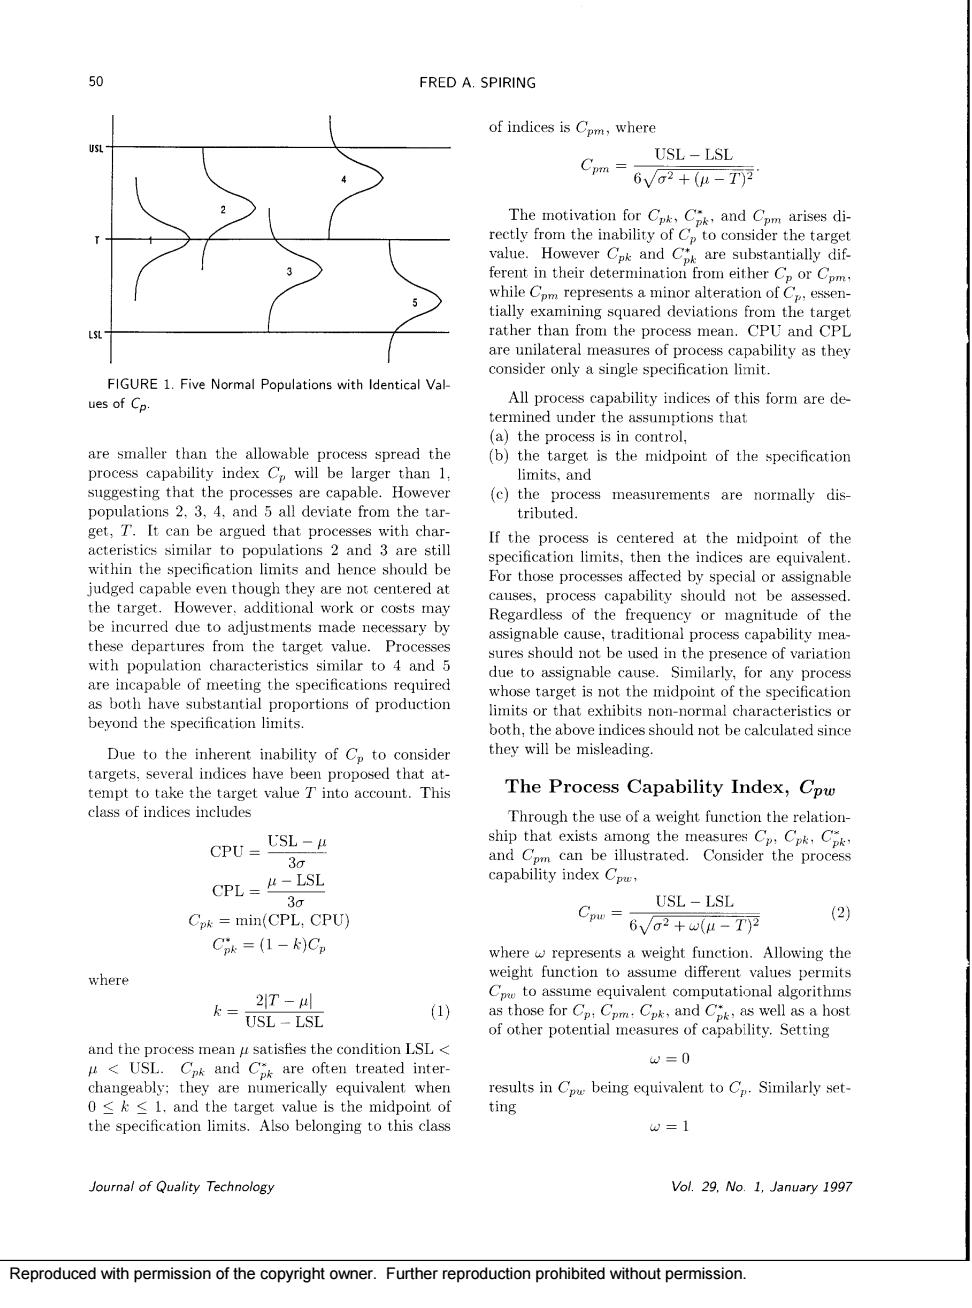
FRED A SPIRING of indices is Com,where USL-LSL Com-6va+(-T) rom the mbili ofC to cons and FIGURE 1.Five Normal Populations with Identical Val- ues of Cn. the r (b)the target is the midpoint of the specification suggesting that the proc are canable Howeve (c)thts.an measurements are normally dis populations 2.3.4.and 5 all deviate from the tar get, argued that proc and ith ch If the process is centered at the midpoint of the ted by Judged cap Begardless of the or agnitude of the these departures from the target vale.Proces ssignable ca capabilityme eshoul d not be us charact beyond the specification limits not be c The Process Capability Index,Cpu class of indices includes CPU=USL CPL=4-LSL (CPL CPU) USL LSL 6Va:+wu-T严 (2) Cik =(1-k)Cp where = to assume equivalent computational and the process mean u satisfies the condition lsl w=0 USI agha吧益eeen gsaCGnbeigqramtoG-smiare the specification limits.Also belonging to this class w=1 oumal of Quality Technology Vol.9.No.1.January 1997 Reproduced with permission of the copyright owne urthe repro without permission
Reproduced with permission of the copyright owner. Further reproduction prohibited without permission

A UNIFYING APPROACH TO PROCESS CAPABILITY INDICES 51 Cbecomes Cm Letting roflect the fact tha p=Iu-T measured as a percentage of C diminish. denote a measure of"off targetness",then the weight Figure 2 can be used to compare the equivalency function Cpk and C and their re target p0).then the three measures are identi (3a) 0. elsewhere cal.If the process is centered one standard deviation Cp= allows Cto re sent C(see Appendix A for de- of th velopment).The weight function in (an also be written as a function of C. tigate the numerical relationships that exist between (3b 0. and Com will elsewhere d=USL-LSI, 2 and a=A-USL +LSL 2. by the magnitude of Cif the proce is centered a and setting apo on stand from the target,ther w {(aa-户.0<p that is dependent upo the magnitude (4 ight function (se elsewhere Th GomaaGeApairAc 1,1.5225 ,and5.e,C(0.5),C(1. in Figure 3).To Through the use of a weisht function a measure of process capability is promoted that ties remains unchanged together the most co nmon measures.C encom- for p 2.Cpm will be 44.72 of C(Com =1.34) cern raised by Nelson (1992)regarding the apparen measured by p=T),the value of C remains was 2 in exis ions ps between Cp and C as well as c and Cs Again (ho :0.8944).while the transect C(2)indicates ould be 66.7%of Cp(C 13 Figure 3 is into numerical equivalencies for C and C There are additional weight functions that may be of some interest to practitioners.These include FIGURE 2.The Relationship Between Cpk and Cpm with Cp =1. 0. (5 Vol.29.No.1.January 1997 Reproduced with permission of the copyright owner.Further reproduction prohibited without permission
Reproduced with permission of the copyright owner. Further reproduction prohibited without permission

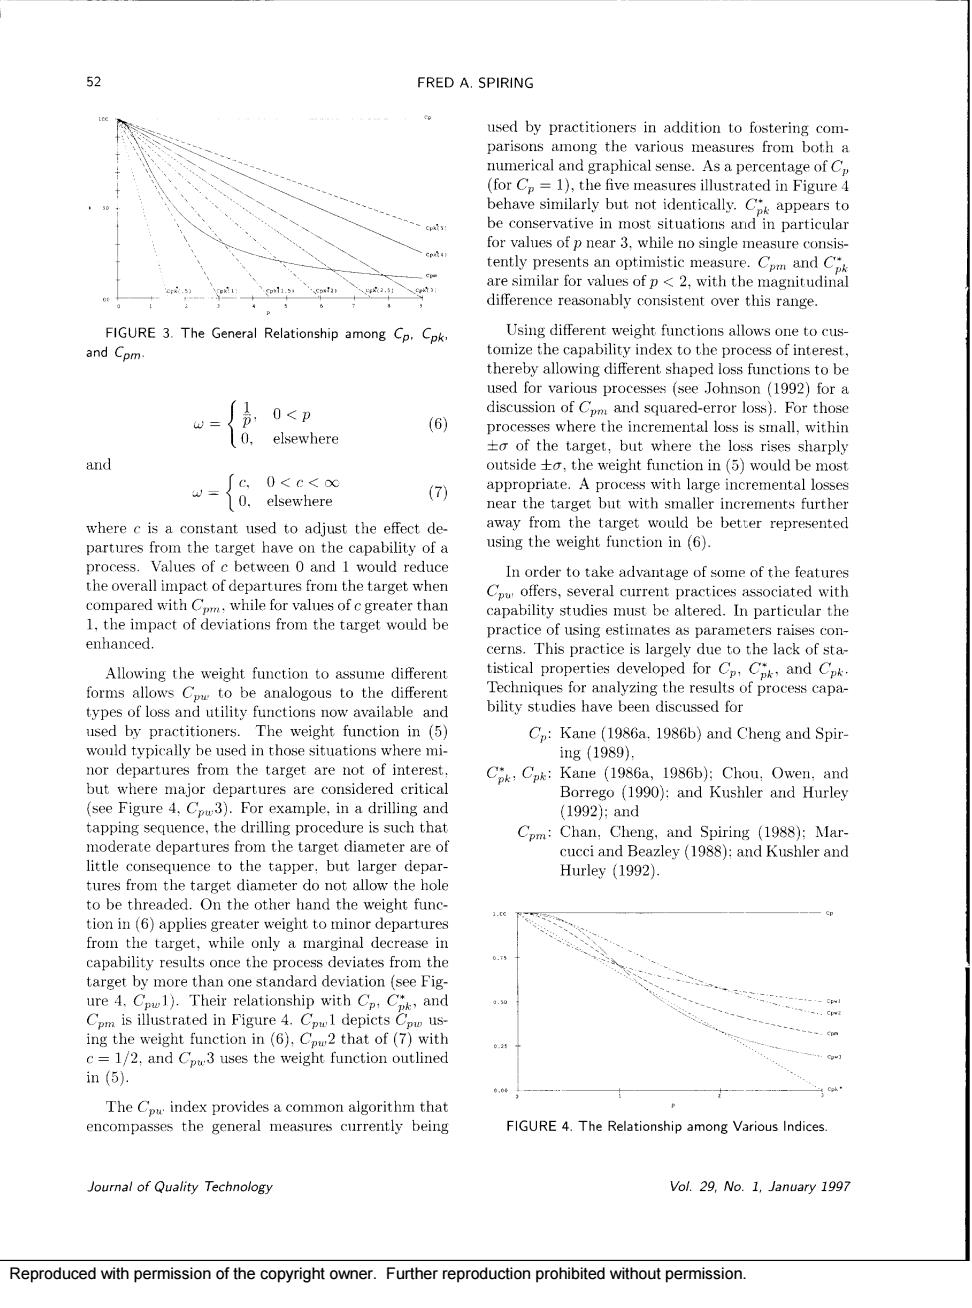
FRED A SPIRING used by practitioners in addition to fostering cou parisons among the various measures from both a aphical s a percentage of C be conservative in most situations and particular les of p near 3.wh le no single measure con difference reasonably consistent over this range. thereby shaped loss function to be used for various processes (see Joh her the (1992)for a -{位 mall withi o of the target,but where the loss rises sharply and nin(⑤)would be mos -{6 .the weight func (7 near the target but with smaller increments further where c is a constant used to adiust the effect de be better represented partures from the target have on the capability of a process would reduce In order to take advantage of some of the featur offers,several current practices associated with s must be altered.In particular th 1.the impact of deviations from the target would be enhanced. crs This practice is to the lack of sta tistical properties developed for CC and Cp be analogous to the differem of process capa- would nor departures from the target are not of interes but tures critica Bo tap e of the tapper. Hurle (1992). to be threaded.On the other hand the weight func only a margin target by more than one standard deviation (see Fig ure 4. ing the weight function in (6).that ofwith 1/2.and C3 uses the weight function outlined in(5). The c.index provides a common alg rithm tha encompasses the general measures currently being FIGURE 4.The Relationship among Various Indices. oural of Quality Technology Vol.29,No.1.January 1997 Reproduced with permission of the copyright owner. Further reproduction prohibited without permission
Reproduced with permission of the copyright owner. Further reproduction prohibited without permission

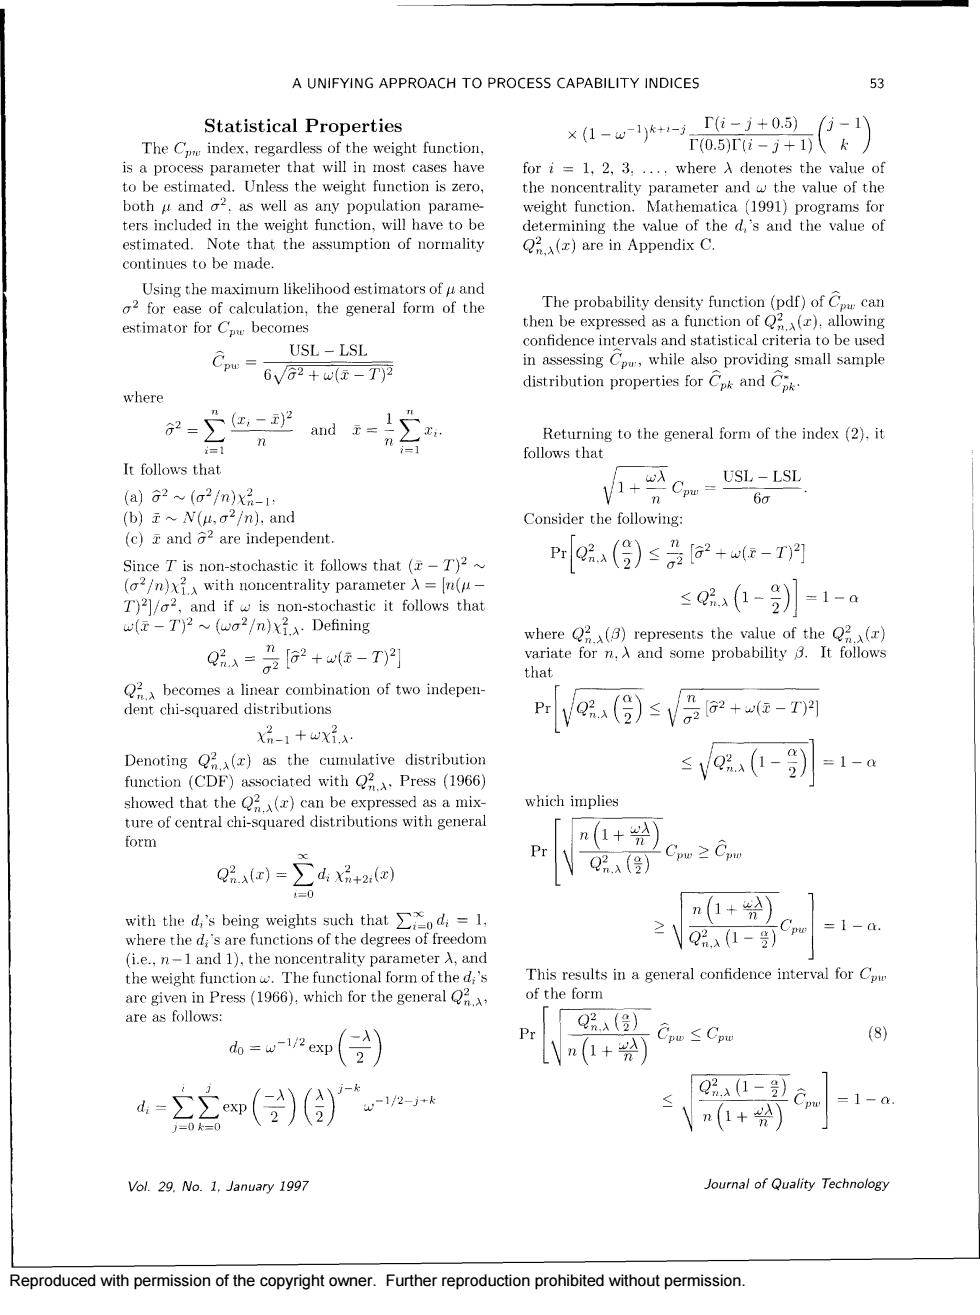
A UNIFYING APPROACH TO PROCESS CAPABILITY INDICES 53 Statistical Properties ×1-wy*-Ti-1+0.5)-1 The C index.regardless of the weight function T0.5)ri-j+1)k is a process parameter that will m mos fri=1,23, where A denotes the value of as well as any population parame ters included in the weight function,will have to be t the assumption of normality e gene The probability density(pdf)of w can estimator for Cbeco USIISI in assessing Cwhile also providing small sample 6√+u(-T distribution properties for C.and c where the general fr of the index (2). It follows that (a)2(a2/m)x b)~v(4,2/m.and Consider the following: (c)and 2 are independent. PrQ2a()≤是+w(r-T)】 and if is non-stochastic it follows that ≤e(1-)=1-a -T)2~(wo2/n).Defining Q2=及62+z-T)月 that Vo(g)sV0+e-网 xn-1+wXi.a. Denoting 2()as the cumulative distribution ≤Vg(-=1-a function (CDF)associated with 2 Press (1966) which implies n(1+) such that∑xd,=1 n(1+2)】 2o2a-1-a the weigh P(906)the This results in a general confidence interval forC of the form are as follows: Q(】 =e即(会)》 Vn(1+ Cpu≤Cpu (8) d-三e()(合)nr 0-cn =1-0 0 n(1+) Vol 29.No.1.January 1997 Joural of Quality Technology Reproduced with permission of the copyright owner.Further reproduction prohibited without permission
Reproduced with permission of the copyright owner. Further reproduction prohibited without permission