Designing a multivariate EWMA control chart Designing a Multivariate EWMA Control Chart SHARAD S.PRABHU SAS Institute,Cary,NC 27515 GEORGE C.RUNGER Arizona State University,Tempe,AZ 85287-5906 ove the detection AmultivariatentrRecommendations provied for the seon of of the scheme. Introduction proces (198).Pignatielo and Runge 1nCkson19 lootrol a univariate control charts on individual variables. process inean vector jndethecontrol h the charts have been used to improve the detection of of the process. rom targe d denote the knowu covarlance matrix of X:as E.The chi-squared chart plots nd Runger() T=X∑-1X age(MEWMA) Howeve because the analysi iations for designing these schemes has been lim 8Dm。 of the Techuical Staf in the Sta schemes that provides recommendations for 11000 oumal of Quality Technology 8 Vol.9.No.1.January 1997 Reproduced with permission of the copyright owner.Further reproduction prohibited without permission
Reproduced with permission of the copyright owner. Further reproduction prohibited without permission. Designing a multivariate EWMA control chart Prabhu, Sharad S; Runger, George C Journal of Quality Technology; Jan 1997; 29, 1; ABI/INFORM Global pg. 8
DESIGNING A MULTIVARIATE EWMA CONTROL CHART 9 r and Prabbu(1gg7)p an it We prefer to plot the statistic NEWNA The select the parameters for the design of a MEWMA g=W:ll 4 aa dcabCarttha pace. Saccucci (1990). The Markov chain analysis pro distribution of can be the distribution ofn I-squared di state.and worst-state cases parameter is a function of the current state of the Markecan MEWMA Control Chart The univariate eWMA chart was introduced by Roberts(1959).Whe the MEWMA is a function o only through the noncentrality parameter,Runge W:=rX:+(1-r)W- where Wo =0 and 0<r 1.The mean and vari- rality that the ance of W are 0 and mean vector is e,where e is the unit vector along the first coordinate axis W can be partition (2-T) s and the remainin nent vecto () with zero mean,denoted as W2.Then. and r are the parameters of the chart.Choices of =Iw=(+w2wg)/2 (6) andrwere presented by Lucas and Saccucci(1990) Because wa is one-dimensional,it is easily approxi (1974) zero mean ever In the multivariate case mated by a one-dimeusioual Markoy chain with tran w=rX+(1-r)W- (2) where Wo is the p-dimensional zero vector,and r is he or with p eedom chain approximation can be used for W O,=V∑V,>H 3) n to achieve a specified in- and Prabhu (1997)). ARLWe the opotie ties.Assume that a Markov chain has s states corre- The performance of a MEWMA chart was shown by sponding be denoted as Pwheu the process mean is6.Let )/.By the transformation we can assume Vol.29.No.1.January 1997 Journal of Quality Technology Reproduced with permission of the copyright owner.Further reproduction prohibited without permission
Reproduced with permission of the copyright owner. Further reproduction prohibited without permission
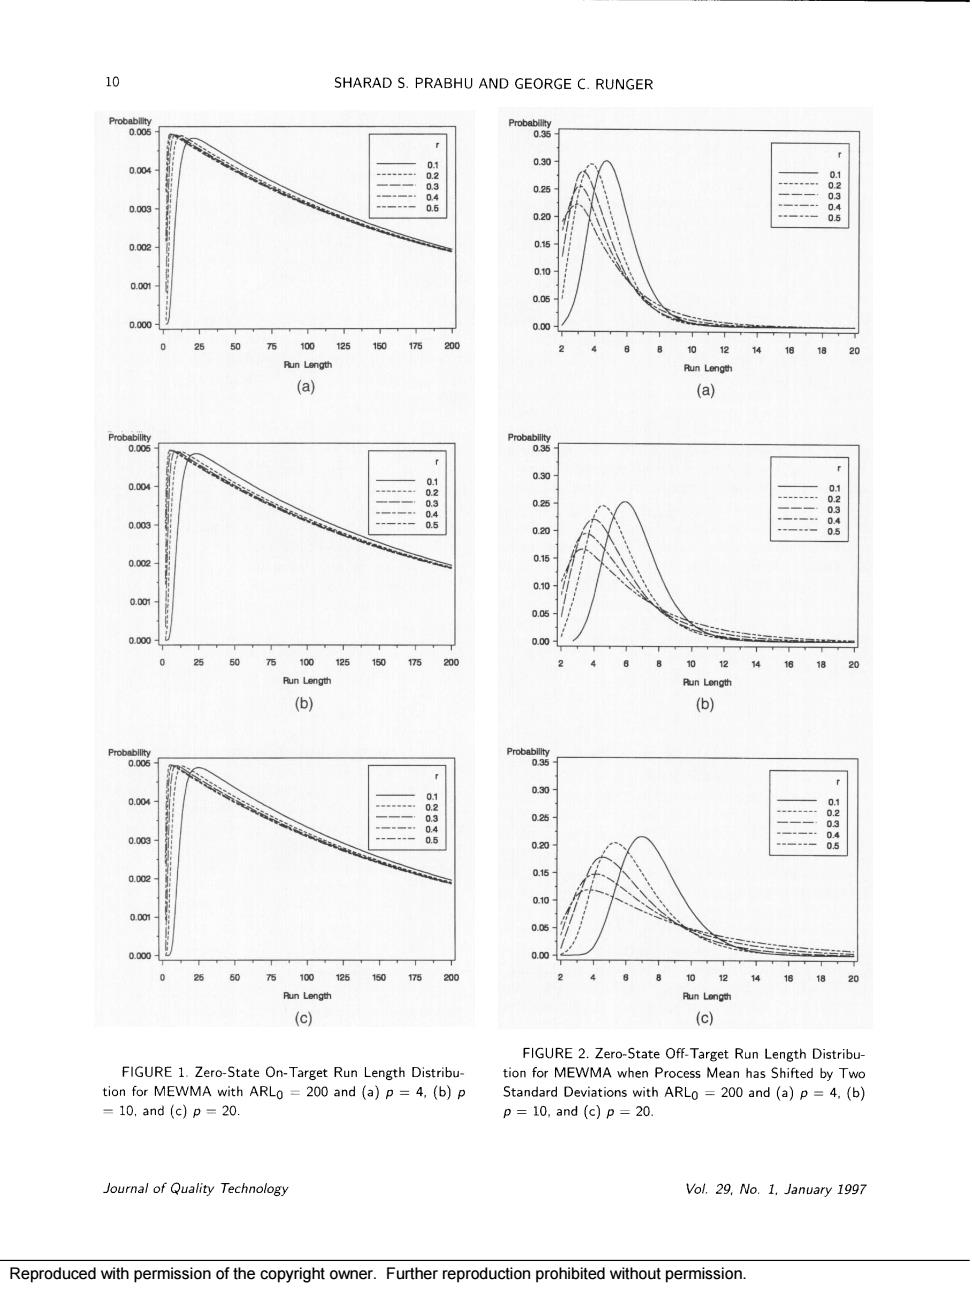
10 SHARAD S.PRABHU AND GEORGE C.RUNGER 0.25 。 (a) 0 20 b 2% (c) (c) FIGURE 2.Zero-State Off-Target Run Length Distribu tion for VMMA whe 55 with ARL o has and (a)p= =10.and(cp=20. p=10.and(c)p=20. Journal of Quality Technology Vol.29.No.1.January 1997 Reproduced with permission of the copyright owner.Further reproduction prohibited without permission
Reproduced with permission of the copyright owner. Further reproduction prohibited without permission

DESIGNING A MULTIVARIATE EWMA CONTROL CHART TABLE 1.Zero-State Average Run Lengths for Multivariate EWMA Control Schemes 0.05 0.10 0.20 0.30 0.40 0.50 0.60 0.80 H 7.35 8.64 9.6 10.08 10.31 10.44 10.52 10.58 2 0.9 248 湖 H 11.22 12.73 3.87 14.34 14.5 04.7 4.8 199.9 D500 128 23 2.7 H= 14.60 16.27 17.51 18.01 18.26 18.39 18.45 18.54 6 200.11 200 199.8 0500 3.0g 24.07 462 24 80 2511 251 10 0500 27.82 30.03 31.59 32.19 32.48 32.63 32.7 32.79 15 05 200.08 20 28 6.16 380 343 oresponding to the starting the cha simulation al. E the s vector of all ones The arls of a contro ate chain divides the vertical axis into m+1 state scheme modeled as a Markov chain is adtehorizoaalarnio2 -I states Initially ARLs=b'(I-Ps)-11. (6) states. In some cases.a value of m -60 is used tale btaodincanca This s n in dibly e numbe he simpl he run length distribution of a two-dimensional Marko (Prabhu and Runger 19961.TC ults apply to Val.29,No.1,January 1997 Joural of Quality Technology Reproduced with permission of the copyright owner.Further reproduction prohibited without permission
Reproduced with permission of the copyright owner. Further reproduction prohibited without permission
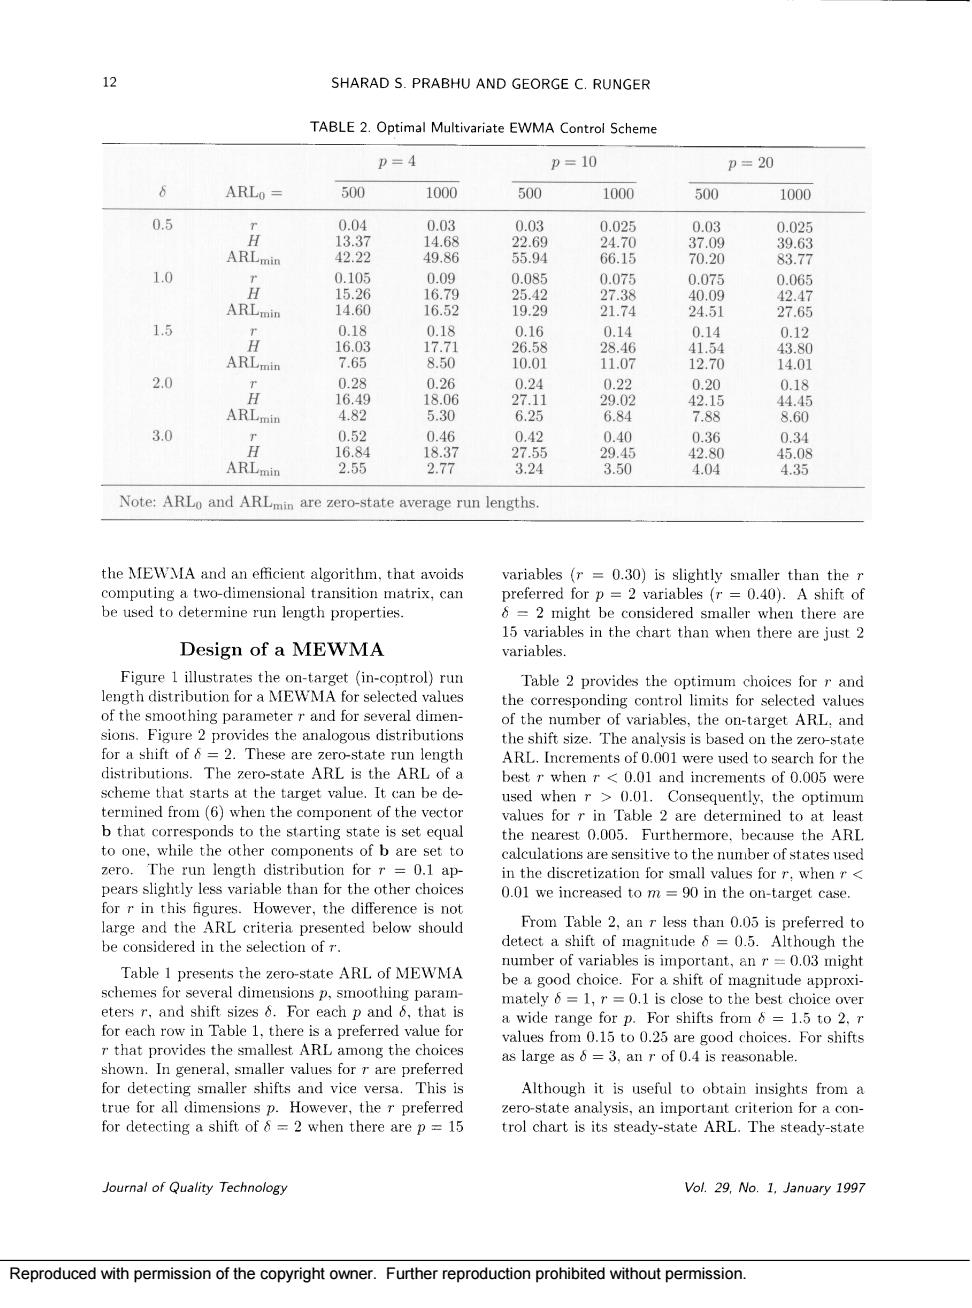
12 SHARAD S.PRABHU AND GEORGE C.RUNGER TABLE 2.Optimal Multivariate EWMA Controi Scheme P=4 p=10 p=20 ARLo= 500 500 1000 500 100 05 02 10 9 14.60 器 1.5 A 器 2.0 器 30 Note:ARLo and ARLmin are zero-state average run lengths. the MEWMA and an efficient algorithm.that avoids variables (r=0.30)is slightly smaller than the 0.40). Design of a MEWMA variables. ovidess the the corres and fo of the number of variables the on-target ARL,and =2.These are zer o-state run length edonthe7rotae The zero-state ARL is the ARLc used Consequently,the optimum ues for5 ed to calculations are sensitive to the umber of states used o e on-target case From Table 2,an r less than 0.05 is preferred to magnitude 6=0.5.Although the presents the zero-state ARL of MEWMA an 0.03 migh mately=,r=0.1 is close to the best choice over for each row in Table 1,there 0=1.5t0 onig the as large as6=3.an r of 0d is Although it is useful to obtain insights from a The steady-stat Journal of Quality Technology Vol.29,No.1.January 1997 Reproduced with permission of the copyright owner.Further reproduction prohibited without permission
Reproduced with permission of the copyright owner. Further reproduction prohibited without permission