ogy:Jan 1997 29 1 AbUINFORM Global Optimal Response Surface Designs in the Presence of Dispersion Effects DARCY P.MAYS Virginia Commonwealth University,Richmond,VA 23284-2014 STEPHEN M.EASTER Randolph-Macon College,Ashland.VA 23005-5505 Standard response surface des e ial d optimal fofirst-or or in ction model,and balanced thre evel factorial des d-ord ever,in many situations the andlevelofdispersiog esign when d with a first-order or in recommendations are made as to what types of designs are preferred in different heterogeneous variance Introduction T tion to a detailed list of references to recent work thecopinloperatiangconditions.Ttisetrendofat aed Taguchi.who incorporated the scientists. berg (and MeCullagh and Pregibon (17)in into a testing problem sion effects,and the use of t eAitkin (1987)and Davidian and Carroll ( r (1986)con rd the ctor desg which are applicabe to many man- ufacturing and scientific processes.However,with Vol.29.No.1.January 1997 Journai of Quality Technology Reproduced with permission of the copyright owner.Further reproduction prohibited without permission
Reproduced with permission of the copyright owner. Further reproduction prohibited without permission. Optimal response surface designs in the presence of dispersion effects Mays, Darcy P; Easter, Stephen M Journal of Quality Technology; Jan 1997; 29, 1; ABI/INFORM Global pg. 59
DARCY P.MAYS AND STEPHEN M.EASTER only a few design or process variables,replication of over the design locations to which runs can actually be allocated. ically.one shoule eneous variance structure.to cates The results that follow involve determining the designs that could be use optimal distribution of design points for a given het when dispersion effects exist.The remainder of the paper The mean models used in the ture and the degree of the variability.One problem timate these models are described.Then the vari mary of the y; process that an "educated stimate of the varianc ommendation s as to which designs should be used in structurecanbr certain situations. be estimated using either some preliminary data or Models and Designs The analysis presented as The experiment consists of N runs,which are allo estimate of the variance structure through previou ferent mean models are considered: ary to experiment a first order model- h=%+E11+2x21+4 Experimental designs are often evaluated with re adtstmationofparametens a partial second-order or interaction model =30+31x14+32x2+12x12+6:(2) oaKfdai2o91od mat design a second-order model: the 斯=风+1+22:+31212 alized variance of the regresio +31x1+32x2,+, (3) the design matrix and Wre the ji ar nting a weight or sion parameters,and the are random errors or e is kno own as integrated variance or I-optimality locations to which the be located. models,such as the fr orde two-level factorial des pre gion ()and N to be the total number of runs the effect inclding the interaction term (Box an in the experiment,the /-optimal design minimizes Draper(1987).H three-leve actorial c Ixw-ix)x that the different variance structures that are consid. trnce (XW-x)xx'dx ered can be implemented.The second-order model the thr In the analysis that follows the evaluation of this in natural choice in this case.It is important to note tegrated variance function is made by averaging only that a three-level factorial structure is used,but tha oual of Qualit Technolo) Vol.29.No.I.January 1997 Reproduced with permission of the copyright owner.Further repr du ction pro hibited without permission
Reproduced with permission of the copyright owner. Further reproduction prohibited without permission
OPTIMAL RESPONSE SURFACE DESIGNS IN THE PRESENCE OF DISPERSION EFFECTS 61 it is not necessary for the optimal design to require the variances at the low and middle levels of the vari- runs at all nine design locations. In addition to requiring three levels of each vari- g the varia structure type for each variable,are linear-linear inear-quadra at its low level,a value of o when the variable is at andatqusdhai vae ofI when the variable nverse quadratic sidered for eacl complete variance structure.Half of the cases involve eao大区hogon n which a me for each variable ance ratio but are。co parameters Th our cases conside d include ca s in which th Variance Structures as 1:1.1:4 and 1:2.1:8.Fortunately.the general con heariance ons depend on the size of the variance ratios,no rogeneous variance patter u in th of onof th hetero ussion,only six variance ratio cases are presented for alled"variance structure types",and the degrees of each variance structure simplest involves homo heterogeneity,callec ratios follows is a th based on ariable Small to moderate degre of dispersio models specified in (1).(2).and (3) 1:5.15 (0 by varianc ratios rsion cat ed,and th sented which fall within this moderate disp egory include 1:4,1:4:1:2.13:and 1:1,1:4).Severe by stating the appropriate variance structure type rati for each variable. 6.8ad22 The individ of the l riances are d but not presented include 1:6,1:6:1:8,1:8:and 1:2. to the highest variane ×2.denoted 1:8 1:V.The values of V and their interpretations are The variances that result from the specification presented shortly nce ratio t One variance structure type is a"linear"varianc and different variance ratios.This standardization (V)/2.and the high level of the variable hasa efactorandceat that are all positive and which sum to nine ariance of V Us- ng a three-lev variance struc MM type is a"quadratic variance structure,which has in the design region ble being os the low and high leve VLH VMH VHH VLM VMM VHM at the VLL VML -VHL ing at the middle level of the variable.Finally cubic"variance structures are considered,in which As an example,consider the case with variance Vol.29.No.1.January 1997 Joura!of Quality Technology Reproduced with permission of the copyright owner.Further reproduction prohibited without permission
Reproduced with permission of the copyright owner. Further reproduction prohibited without permission
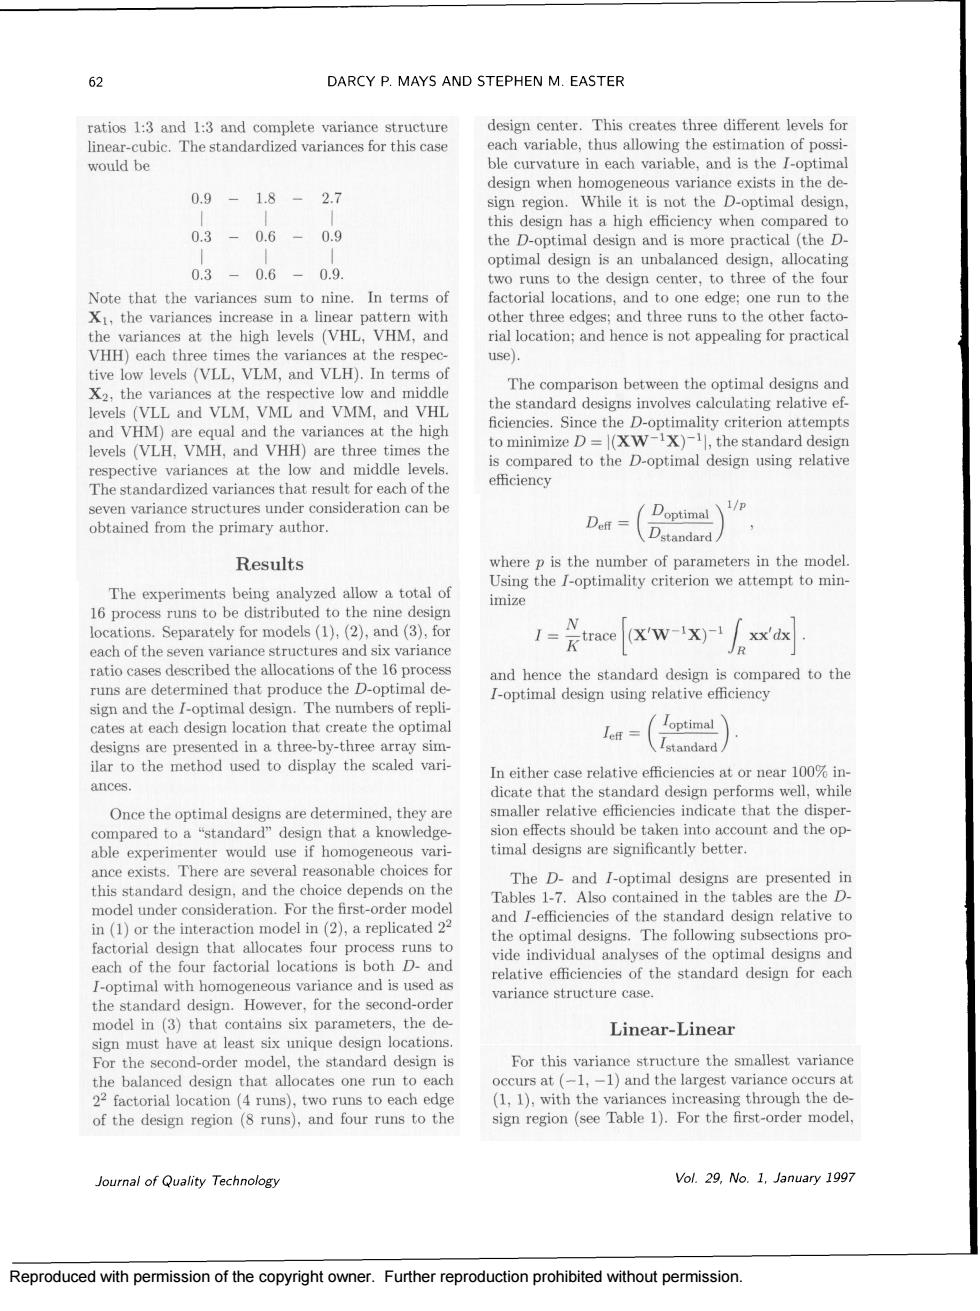
62 DARCY P.MAYS AND STEPHEN M.EASTER ratios 1:3 and 1:3 and complete variance structure design center.This creates three different levels for linear-cubic.The standardized variances for this case would be 0.9- 1.8-2.7 io the D-optimal de 0.3-0.6-0.9 this 0.3-0.6-09 optimal design is an unbalanced design,allocating In terms o 5,a d thre the variances at the high levels (VHL.VHM.and rial location:and hence is not appealing for practical use). at the ective low and middle an the standard designs involves calculating relative ef empt Thetandadodrianesthatresutorachofthe obtained fom the primary author. () Results wher ters in the mode The experiments being analyzed allow a total of mize 1=rae[xw-x/人xx ratio cases described the allocations of the 16 proces the the standard desig is co optimal d a-( In either case relative efficiencies at or near 100%in dicate that the standard design performs well,whil Once the optimal designs are determined,they are timal designs are significantly better. ction model in ()replicated and /-efficiencies of the standard design relative to fac optimal designs.The following subsections pro runs to ide indiv the standard design However.for the second-order ariance structure case model in (3)that contains six parameters, the Linear-Linear sign mus dor model.the standard design is For this variance structure the smallest variance balanced design that allocates one rn to each ccurs at(-1,-1)and the largest variance occurs a odel Journal of Quality Technology Vol.29.No.1.January 1997 Reproduced with permission of the copyright owner Further reproduction prohibited without permissior
Reproduced with permission of the copyright owner. Further reproduction prohibited without permission
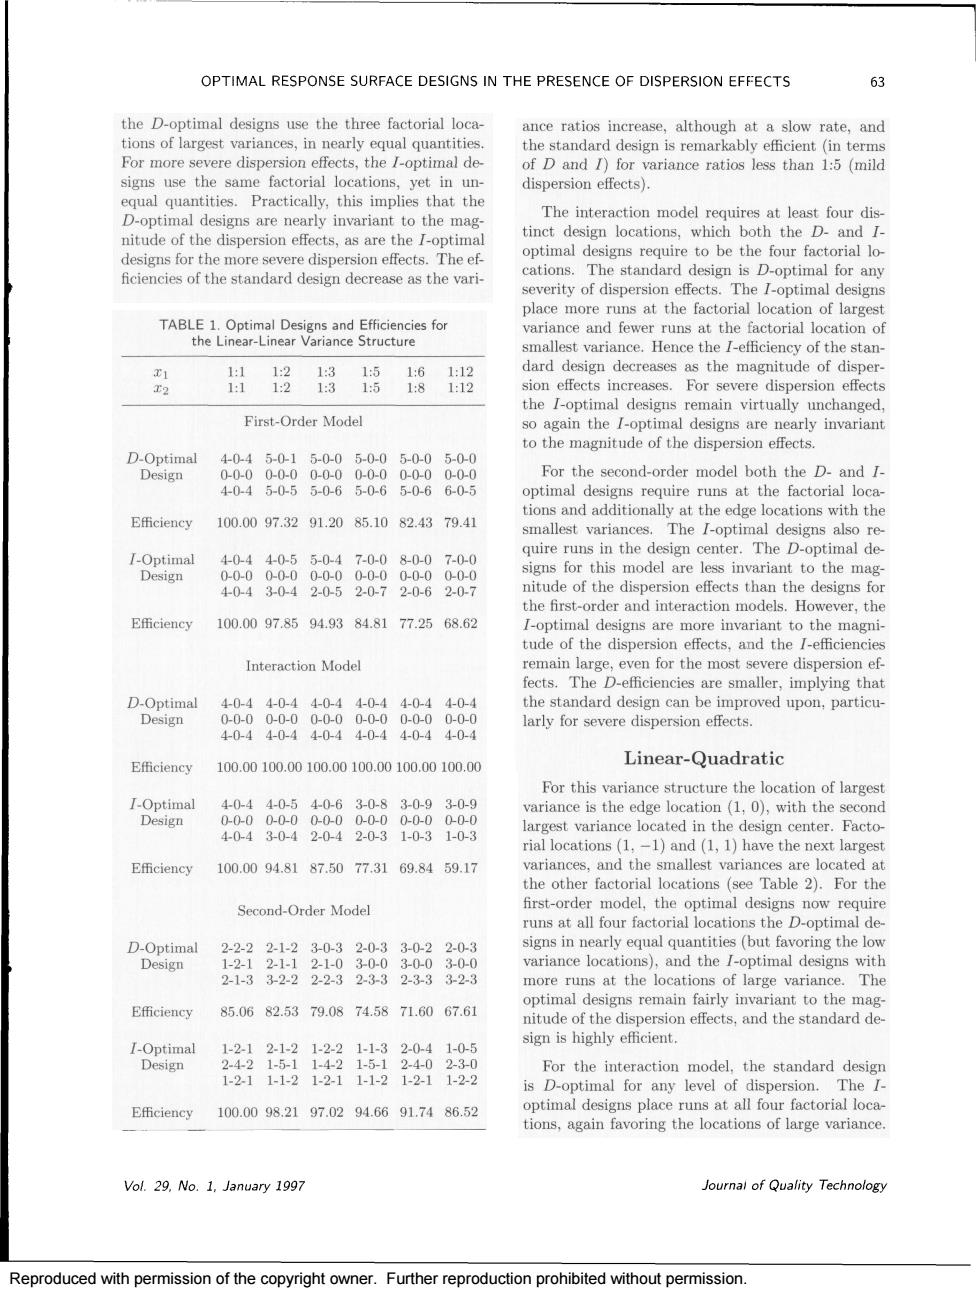
OPTIMAL RESPONSE SURFACE DESIGNS IN THE PRESENCE OF DISPERSION EFFECTS 6 the D-optimal designs use the three factorial loca- ance ratios increase.although at a slow rate.and the standard design is remarkably efficient (in term suse the tim The interaction model requires at least four dis signs for the m ocation D-and ficiencies of the standard design decrease as the vari- cations. of larges mallest variance.Hence the f-efficiency of the stan the f-optimal designs First-Order Model so again the I-optimal designs are nearly invariant to the magnitude of the dispersion effects. For the second-order model both the D.and I optimal designs require runs at the factorial loca Efficiency100.0097.3291.2085.1082.4379.41 sandaditionmlkathee ocations with the quire runs in the design center.The D-optimal de signs for the mag designs Efficieney 100.0097.8591.9384.81772568.62 I-optimal designs are more invariant to the magni- tude of the dispersion effects,and the InteractionModel fectThe D-ecnc mplving that Do the standard design can be improved upon,particu- larly for severe dispersion effects Efficiency 100.00100.00100.00100.00100.00100.00 Linear-Quadratic t variance located in the design center.Facto E伍ciency c(1)and (1 the 100.0094.8187.50773169.8459.17 the Second-Order Model first-order model,the optimal designs now require uns at all four fact l de timal designs with more runs at the locations of large variance.The Efficiency 85.0682.5379.0874.5871.6067.61 ign is highly efficient 18 For the interactio model.the standard desig Efficiency100.0098.2197.0294.6691.7486.52 optimal designs place runs at all four factorial loca tions.again favoring the locations of large variance. Vol.29.No.1.January 199 Reproduced with permission of the copyright owner.Further reproduction prohibited without permission
Reproduced with permission of the copyright owner. Further reproduction prohibited without permission