电子科线女学光电科学与工程学院 SCHOOL OF OPTOELECTRONIC SCIENCE AND ENGINEERING OF UESTC Outline Background Preliminary Concepts Sampling and the Fourier Transform of Sampled Functions The Discrete Fourier Transform of One Variable Extension to Functions of Two Variables Some Properties of the 2-D Discrete Fourier Transform The Basics of Filtering in the Frequency Domain Image Smoothing Using Frequency Domain Filters Image Sharpening Using Frequency Domain Filters Selective Filtering
Outline ◆ Background ◆ Preliminary Concepts ◆ Sampling and the Fourier Transform of Sampled Functions ◆ The Discrete Fourier Transform of One Variable ◆ Extension to Functions of Two Variables ◆ Some Properties of the 2-D Discrete Fourier Transform ◆ The Basics of Filtering in the Frequency Domain ◆ Image Smoothing Using Frequency Domain Filters ◆ Image Sharpening Using Frequency Domain Filters ◆ Selective Filtering

电子科线女学光电科学与工程学院 SCHOOL OF OPTOELECTRONIC SCIENCE AND ENGINEERING OF UESTC 4.3 Sampling and Fourier Transform of Sampled Functions Agenda Sampling The Fourier Transform of Sampled Functions The Sampling Theorem Aliasing Function Reconstruction (Recovery)from Sampled Data
Sampling The Fourier Transform of Sampled Functions The Sampling Theorem Aliasing Function Reconstruction (Recovery) from Sampled Data 4.3 Sampling and Fourier Transform of Sampled Functions Agenda
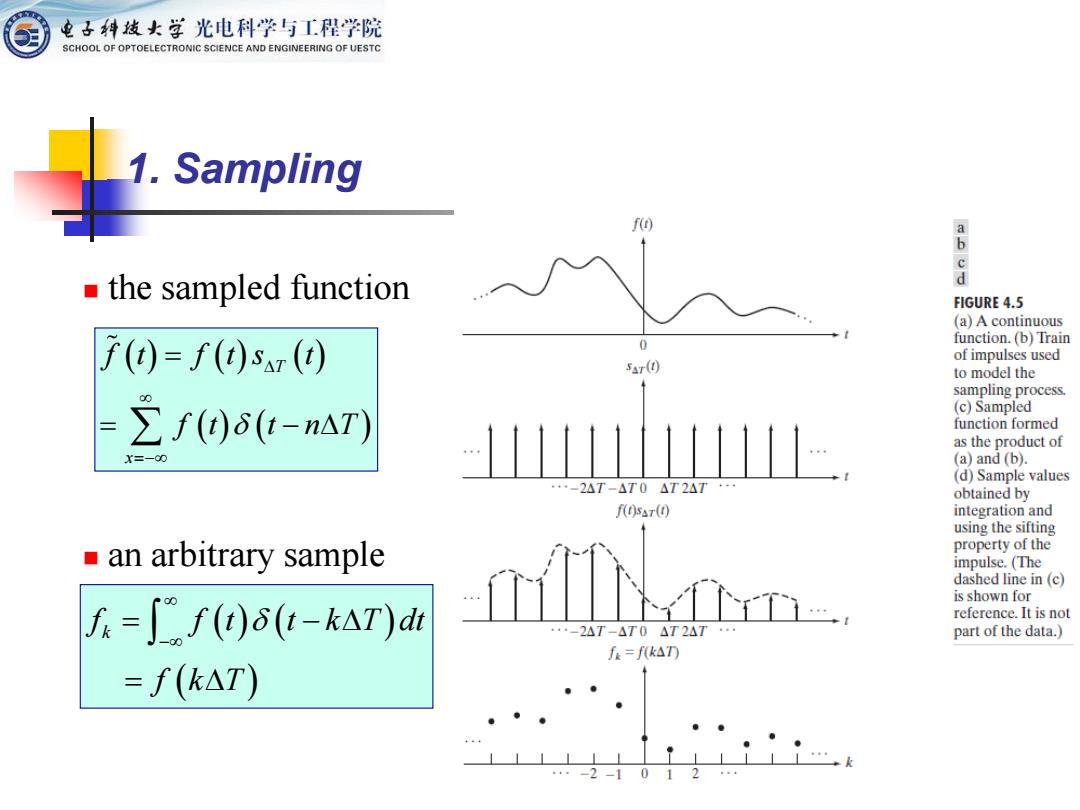
电子科妓女草光电科学与工程学院 SCHOOL OF OPTOELECTRONIC SCIENCE AND ENGINEERING OF UESTC 1.Sampling f() do the sampled function d FIGURE 4.5 (a)A continuous 子()=f()sr() 0 function.(b)Train of impulses used 5r(0 to model the sampling process ∑f()δ(t-n△T) (c)Sampled function formed as the product of X=-00 (a)and (b). (d)Sample values -2AT-AT0△T2AT·· obtained by f(t)sar(t) integration and using the sifting ■ an arbitrary sample property of the impulse.(The dashed line in (c) is shown for f=f(t)6(t-kAT)dt reference.It is not -2AT-△T0△T24T part of the data.) f=fk△TD =f(kAT) -2-10
1. Sampling ( ) ( ) ( ) ( ) ( ) T x f t f t s t f t t n T =− = = − ( ) ( ) ( ) k f f t t k T dt f k T − = − = ◼ the sampled function ◼ an arbitrary sample
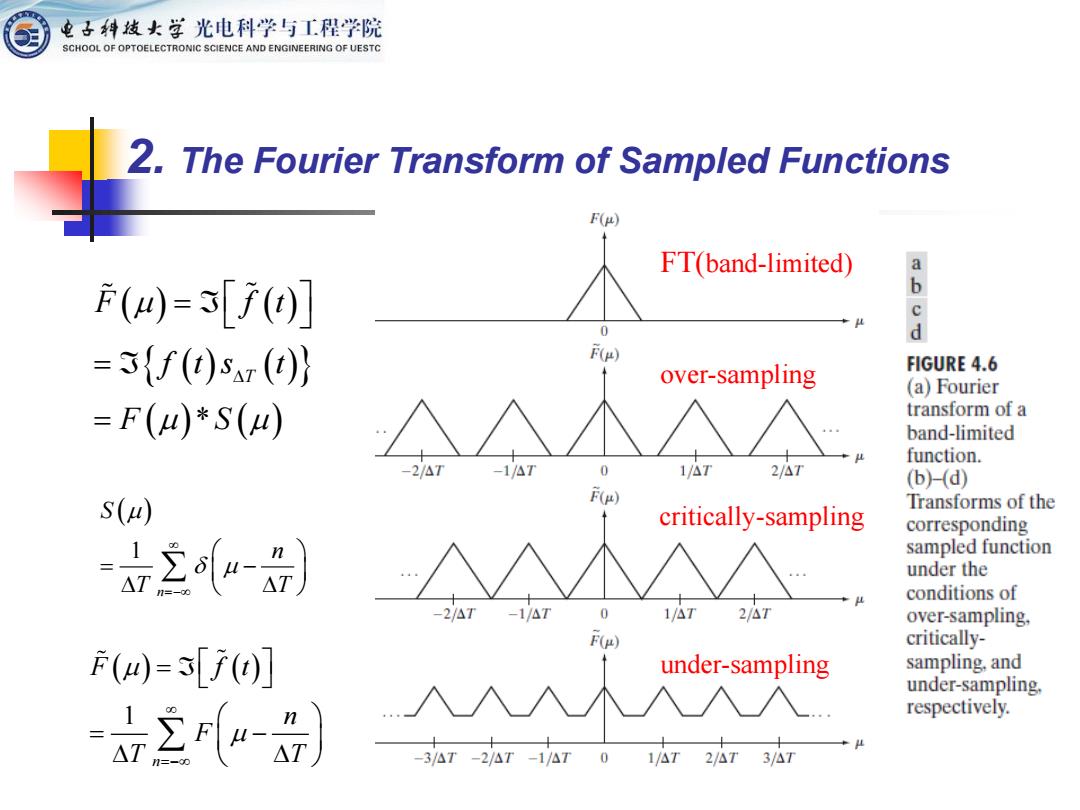
电子科发女学光电科学与工程学院 SCHOOL OF OPTOELECTRONIC SCIENCE AND ENGINEERING OF UESTC 2.The Fourier Transform of Sampled Functions F(p) FT(band-limited) F(4=[f)] b d =5{f()sr()} F over-sampling FIGURE 4.6 (a)Fourier =F(四)*S(4) transform of a band-limited function. 1/△7 2/△7 (b)(d) S(u) F() critically-sampling Transforms of the corresponding =三“-) sampled function under the conditions of -2/△ -1/AT 1/△T2/△T over-sampling, F) critically- (4)=[f(0] under-sampling sampling,and under-sampling. respectively. ru-品) -3AT-2/AT-1/△T01/△T2/△T 3/△7
2. The Fourier Transform of Sampled Functions ( ) ( ) ( ) ( ) ( )* ( ) T F f t f t s t F S = = = ( ) 1 n S n T T =− = − ( ) ( ) 1 n F f t n F T T =− = = − FT(band-limited) over-sampling critically-sampling under-sampling
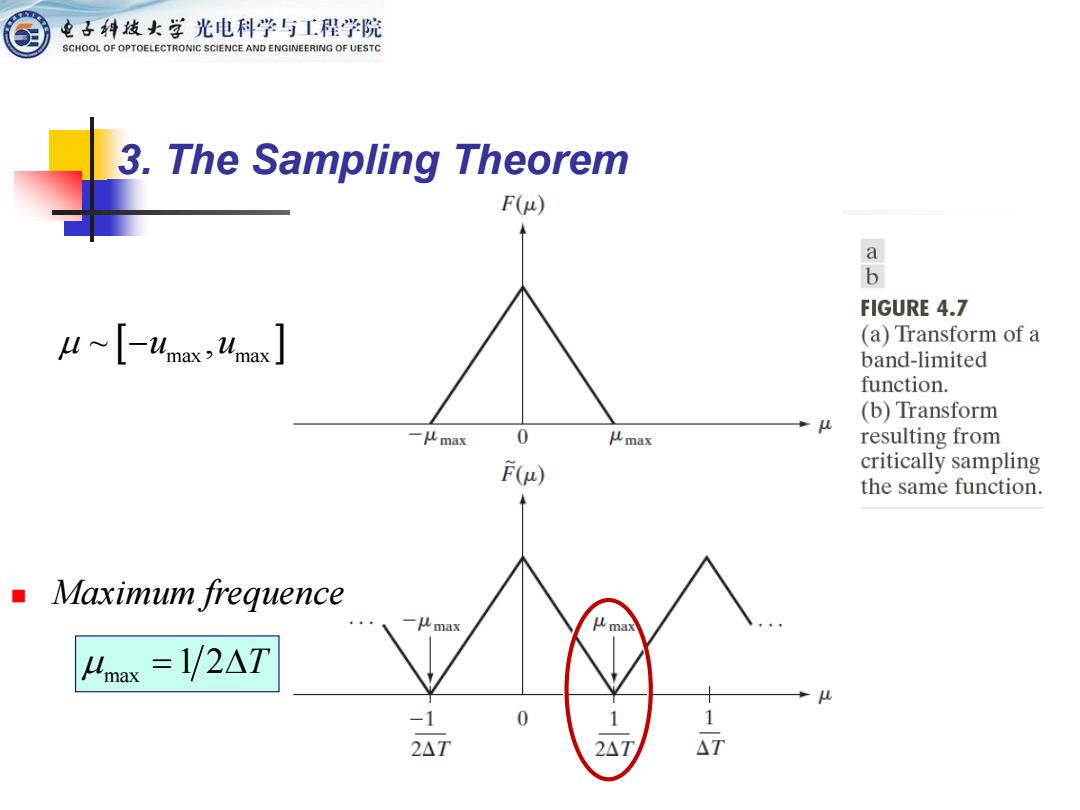
电子科发女学光电科学与工程学院 SCHOOL OF OPTOELECTRONIC SCIENCE AND ENGINEERING OF UESTC 3.The Sampling Theorem F() 8 FIGURE 4.7 Ums Umas (a)Transform of a band-limited function. (b)Transform 一lmax 0 Amax resulting from F(p) critically sampling the same function. Maximum frequence 一lmax max Lmax =1/2AT 1 0 2△T 2△T △T
~ , −u u max max 3. The Sampling Theorem max = 1 2 T ◼ Maximum frequence