电子科发女草光电科学与工程学院 SCHOOL OF OPTOELECTRONIC SCIENCE AND ENGINEERING OF UESTC 3.The Sampling Theorem Maximum frequence Lmas =1/2AT Sampling Theorem (1928) >2μm △T Nyquist sampling rate Harry Nyquist (1889-1976)
◼ Sampling Theorem (1928) max 1 2 T max = 1 2 T Harry Nyquist (1889-1976) 3. The Sampling Theorem max 1 2 N f T → = ◼ Nyquist sampling rate ◼ Maximum frequence

电子科发女学光电科学与工程学院 SCHOOL OF OPTOELECTRONIC SCIENCE AND ENGINEERING OF UESTC 3.The Sampling Theorem F() a c 一lmax max FIGURE 4.8 Extracting one -2/△T -1/△7 0 1/△T 2/△T period of the transform of a H(p) band-limited function using an △T ideal lowpass ILPF filter. 0 F(W)=H()F() F(p)=H(u)F() H(4)= AT,-nmax≤L≤Umax f(t)=3[F()] 0, otherwise -Mmax 0 Mmax
3. The Sampling Theorem ( ) max max , 0, T u u H otherwise − = ILPF
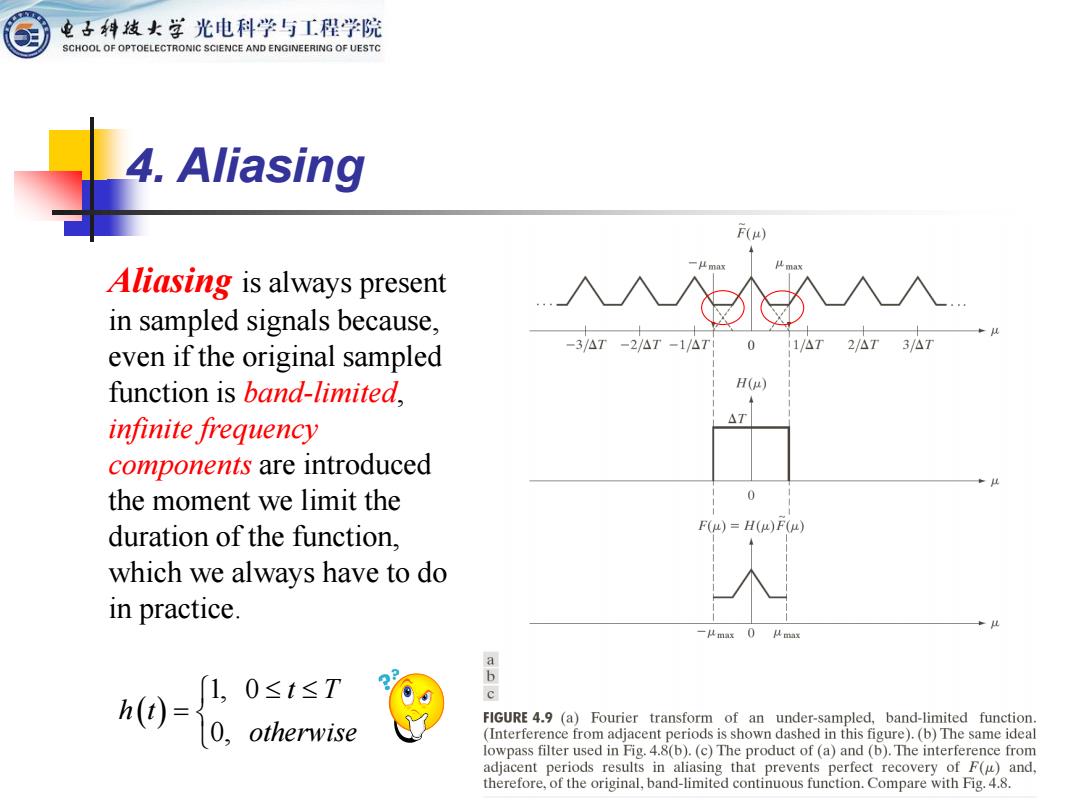
电子科发女学光电科学与工程学院 SCHOOL OF OPTOELECTRONIC SCIENCE AND ENGINEERING OF UESTC 4.Aliasing F() Aliasing is always present in sampled signals because, 入入 -3/△T-2/△T-1/△T 0 11/△T2/△ ”3/△7 even if the original sampled function is band-limited, H() infinite frequency △T components are introduced the moment we limit the 0 duration of the function, F()=H(R)F() which we always have to do in practice. 一μmax0'mnx 1,0≤t≤T c nO h(0.otherwise FIGURE 4.9 (a)Fourier transform of an under-sampled,band-limited function (Interference from adjacent periods is shown dashed in this figure).(b)The same ideal lowpass filter used in Fig.4.8(b).(c)The product of (a)and(b).The interference from adjacent periods results in aliasing that prevents perfect recovery of F(u)and, therefore,of the original,band-limited continuous function.Compare with Fig.4.8
4. Aliasing Aliasing is always present in sampled signals because, even if the original sampled function is band-limited, infinite frequency components are introduced the moment we limit the duration of the function, which we always have to do in practice. ( ) 1, 0 0, t T h t otherwise =
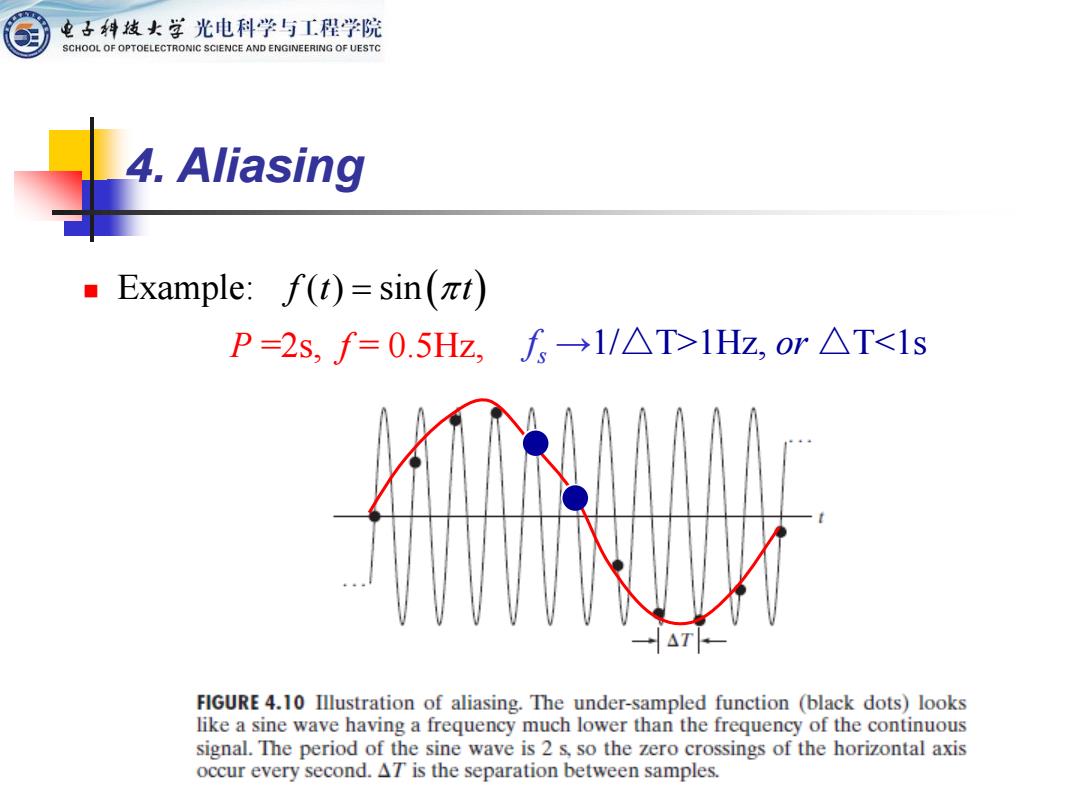
电子科发女学光电科学与工程学院 SCHOOL OF OPTOELECTRONIC SCIENCE AND ENGINEERING OF UESTC 4.Aliasing Example:f(t)=sin(at) P=2s,f=0.5Hz,f→1/△T>1Hz,or△T<1s →AT FIGURE 4.10 Illustration of aliasing.The under-sampled function (black dots)looks like a sine wave having a frequency much lower than the frequency of the continuous signal.The period of the sine wave is 2 s,so the zero crossings of the horizontal axis occur every second.AT is the separation between samples
4. Aliasing f t t ( ) sin = ( ) P =2s, f = 0.5Hz, f s →1/△T>1Hz, or △T<1s ◼ Example:

电子科发女学光电科学与工程学院 SCHOOL OF OPTOELECTRONIC SCIENCE AND ENGINEERING OF UESTC 5.Function Reconstruction from Sampled Data in the spatial domain 0=3'[Ei-川 and 子)=f()s()=∑f(6(t-nAT) thus ()(nAT)sine[(-nAT)/AT]
5. Function Reconstruction from Sampled Data ( ) ( ) ( ) ( ) ( ) ( ) 1 1 f t F H F h t f t * − − = = = ( ) ( )sin ( ) n f t f n T c t n T T =− = − ◼ in the spatial domain ◼ and ( ) ( ) T ( ) ( ) ( ) x f t f t s t f t t n T =− = = − ◼ thus