26 ZACHARY G.STOUMBOS AND MARION R.REYNOLDS IR ery 250 hours,which is 1/250 =0.004 false alarms an SPRT in the SPRT chart be the expected value per hour. ATS be expressed as the Another useful measure for the evaluation of cor trol charts is the average observation rte (AOR) e at each AOR is defined to chart long rin average mum ASN mit of time trol charts with respect to sample size.Expressions ANOS/ATS. and the ANOS is 1500 observations when ARL.ATS.ANOS.and SSATS of the SPRT chart then this corresponds to I CUSUM Control Schemes The effectiveness in detecting a shift to.If =01a tiona ime to charts an n compariso othe =0.In many applications,however.it may be Specifically.the performance of the SP chart wil formances of the standard more me tha the process of should be computed from the random point that use the VSS and VSI features either individu- that shift r than any of th ne(nd for VSI the other is more than one interva length in which the shift For the of this paper the tem often onmite from time t As in previous work ( chart"and "one-sided CUSUM chart" and Arold (1)or Runger and statistic to have reached a steady-state or station the VSS CUSUM regions -0,cn and (ca.h,spec sample i edately befor tying the use of the sample sizes n and wl。 spe 19g0 the switching bourdary between the YSI CUSUV bility of the shift falling in a sampling interva l of a regions (-c. ca and (ca,h,specifying the use of s pr roportional tot ectively.whe (for oositive shifts)will be viewed as the specia of the one-sided C USUM chart with ollowing r occurs in a sampling interval.the position of the shif within the sampling interval is unilormly distribute chart with h=0 and y=3/vn. inter nptions will be called the steadu-state ATS (SSATS). CUSUM schemes,along with respective values for Finally.let the average sample number (ASN)of the control parameters y and h,and the switching ournai of Quality Technolog Vol.29.No.1,January 1997 Reproduced with permission of the copyright owner.Further reproduction prohibited without permission
Reproduced with permission of the copyright owner. Further reproduction prohibited without permission
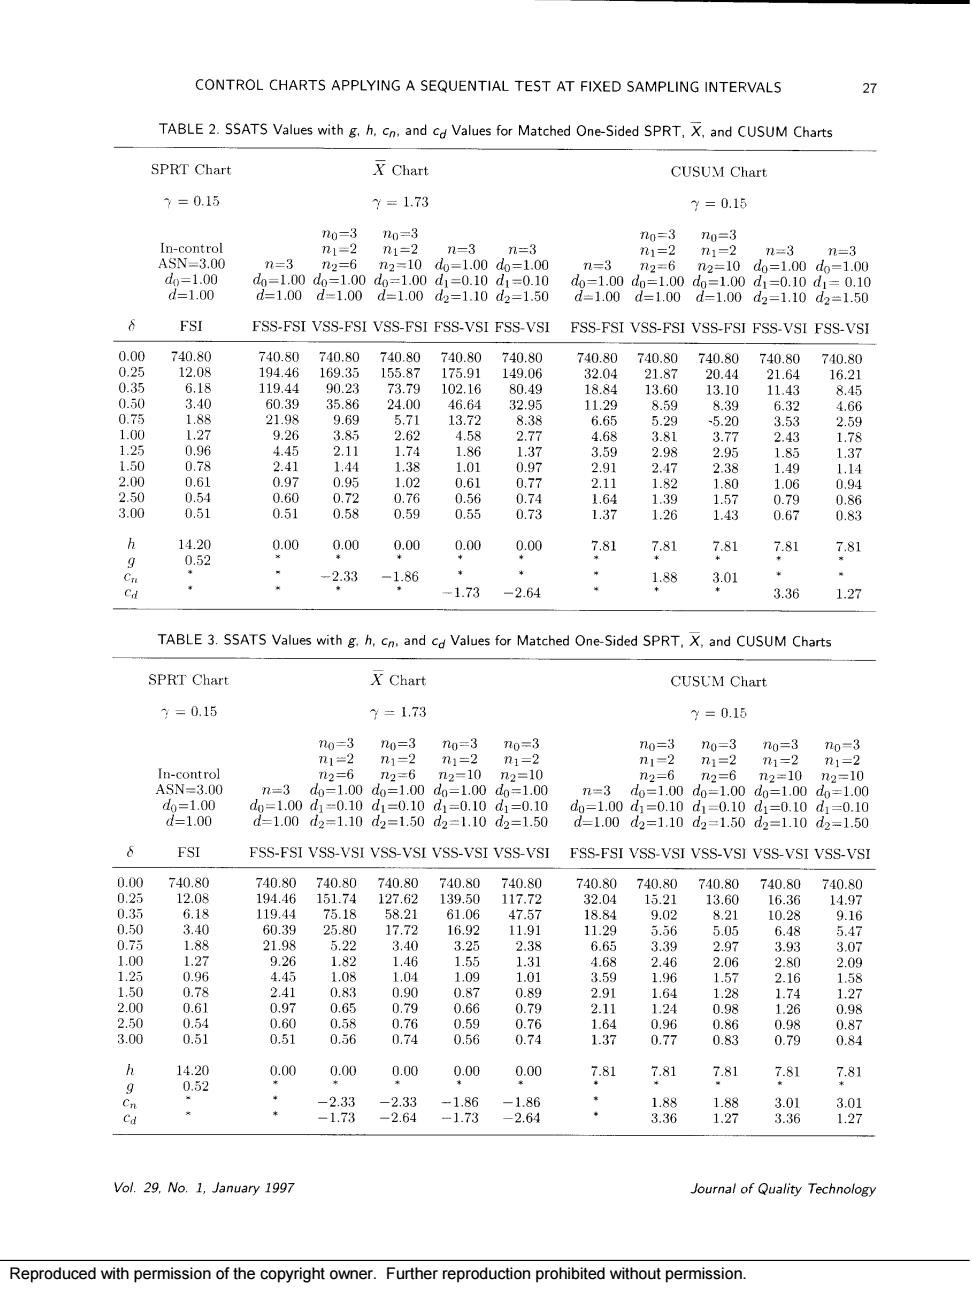
CONTROL CHARTS APPLYING A SEQUENTIAL TEST AT FIXED SAMPLING INTERVALS TABLE 2.SSATS Values with g.h.co.and c Values for Matched One-Sided SPRT X and CUSUM Charts SPRT Char Chart CUSUM Chart =0.15 y=1.73 y=0.15 no-3 nomtTo 1-2 1=3 品 d-1.00 d=1.00d=i.00d=1.00d2110d2=150 FSI FSS-FSI VSS-FSIVSS-FSI FSS-VSI FSS-VSI FSS-FSI VSS-FSI VSS-FSI FSS-VSI FSS-VSI 829 7980 7408 740.80 740.80 162 24.0 21.9 2 -5 9 26 .3 30 97 23 05 0.59 8 器 0.00 0.00 0.00 00 781 7.81 7.81 781 7.81 -2.33 -1.86 1.88 3.01 1.73 2.64 3.36 1.27 TABLE 3.S5AT5 Values with g.h,cn.and cd Values for Matched One-Sided SPRT,X.and CUSUM Charts SPRT Chart XChar CUSUM Chart =0.15 =1.73 =015 w-d 100 6 FSI FSS-FSI VSS-VSI VSS-VSIVSS-VSI VSS-VSI FSS-FSI VSS-VSI VSS-VSI VSS-VSI VSS-VS 器 740.89 19 721 71830 2.97 898 1.04 .0 052 169 0.00 0.00 0.00 0.00 0.00 7.81 7.81 7.81 781 Vol.29.No.1,January 1997 Journal of Quality Technology Reproduced with permission of the copyright owner.Further reproduction prohibited without permission
Reproduced with permission of the copyright owner. Further reproduction prohibited without permission