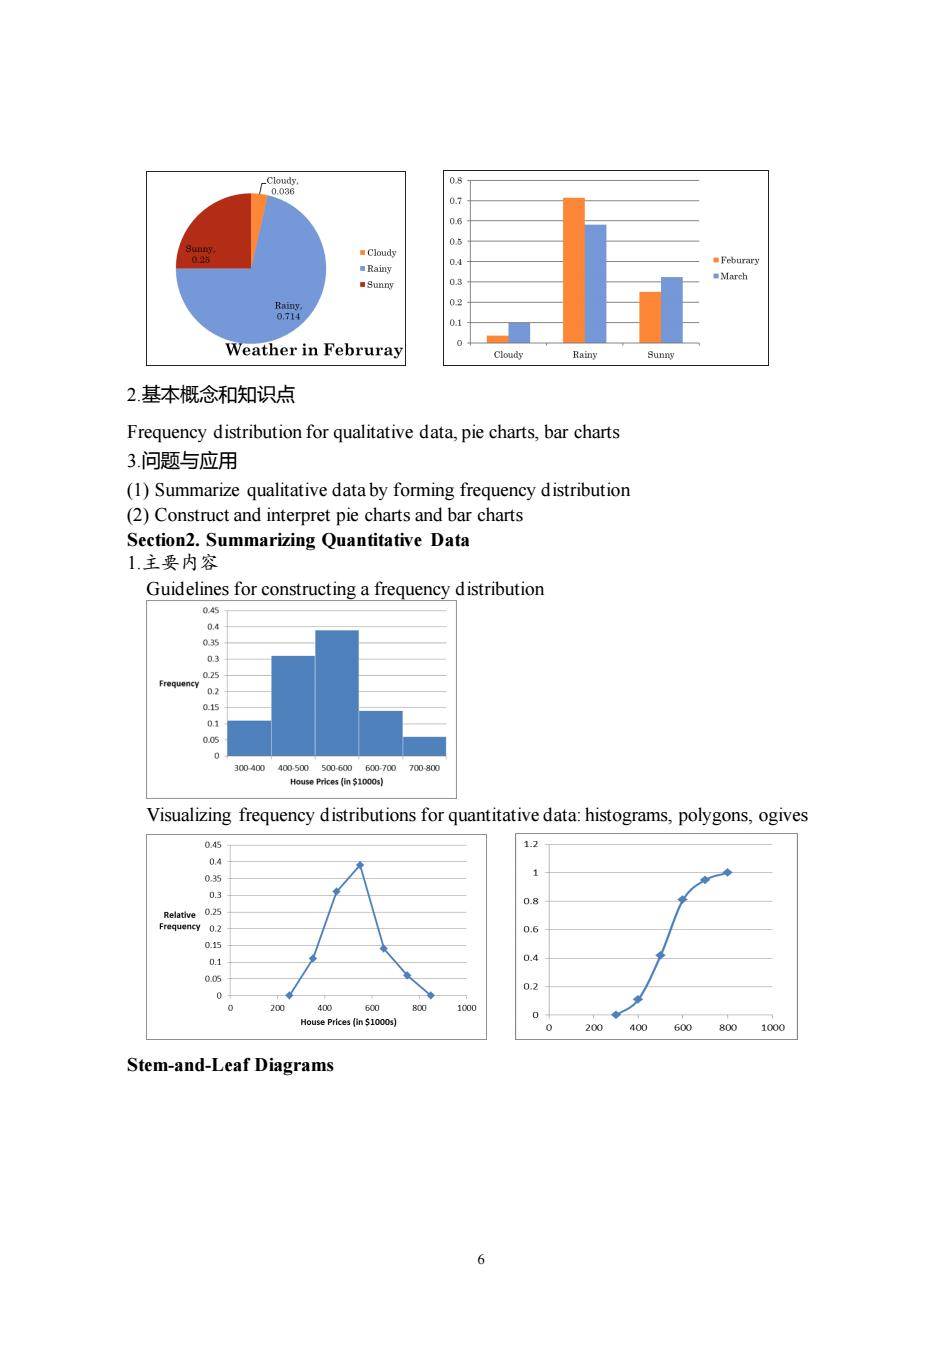
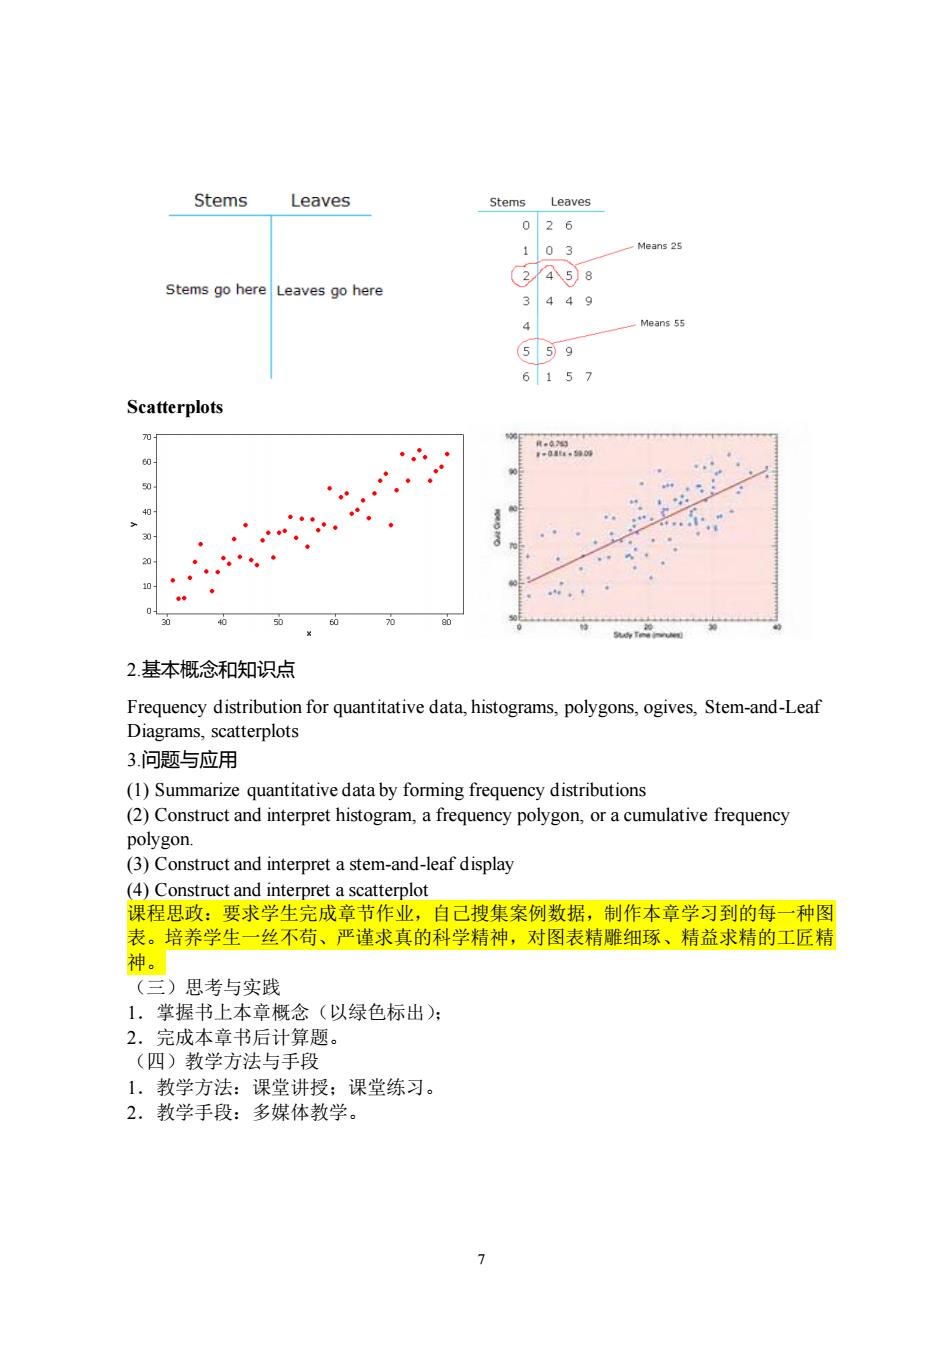
Weather in Februray 2.基本概念和知识点 Frequency distribution for qualitative data,pie charts,bar charts 3.问题与应用 (1)Summarize qualitative data by forming frequency distribution (2)Construct and interpret pie charts and bar charts Section2.Summarizing Quantitative Data 1.主要内容 Guidelines for constructing a frequency distribution Visualizing frequency distributions for quantitative data:histograms,polygons,ogives 1.2 1 01 200 40 600 800 Stem-and-Leaf Diagrams 6
6 2.基本概念和知识点 Frequency distribution for qualitative data, pie charts, bar charts 3.问题与应用 (1) Summarize qualitative data by forming frequency distribution (2) Construct and interpret pie charts and bar charts Section2. Summarizing Quantitative Data 1.主要内容 Guidelines for constructing a frequency distribution Visualizing frequency distributions for quantitative data: histograms, polygons, ogives Stem-and-Leaf Diagrams
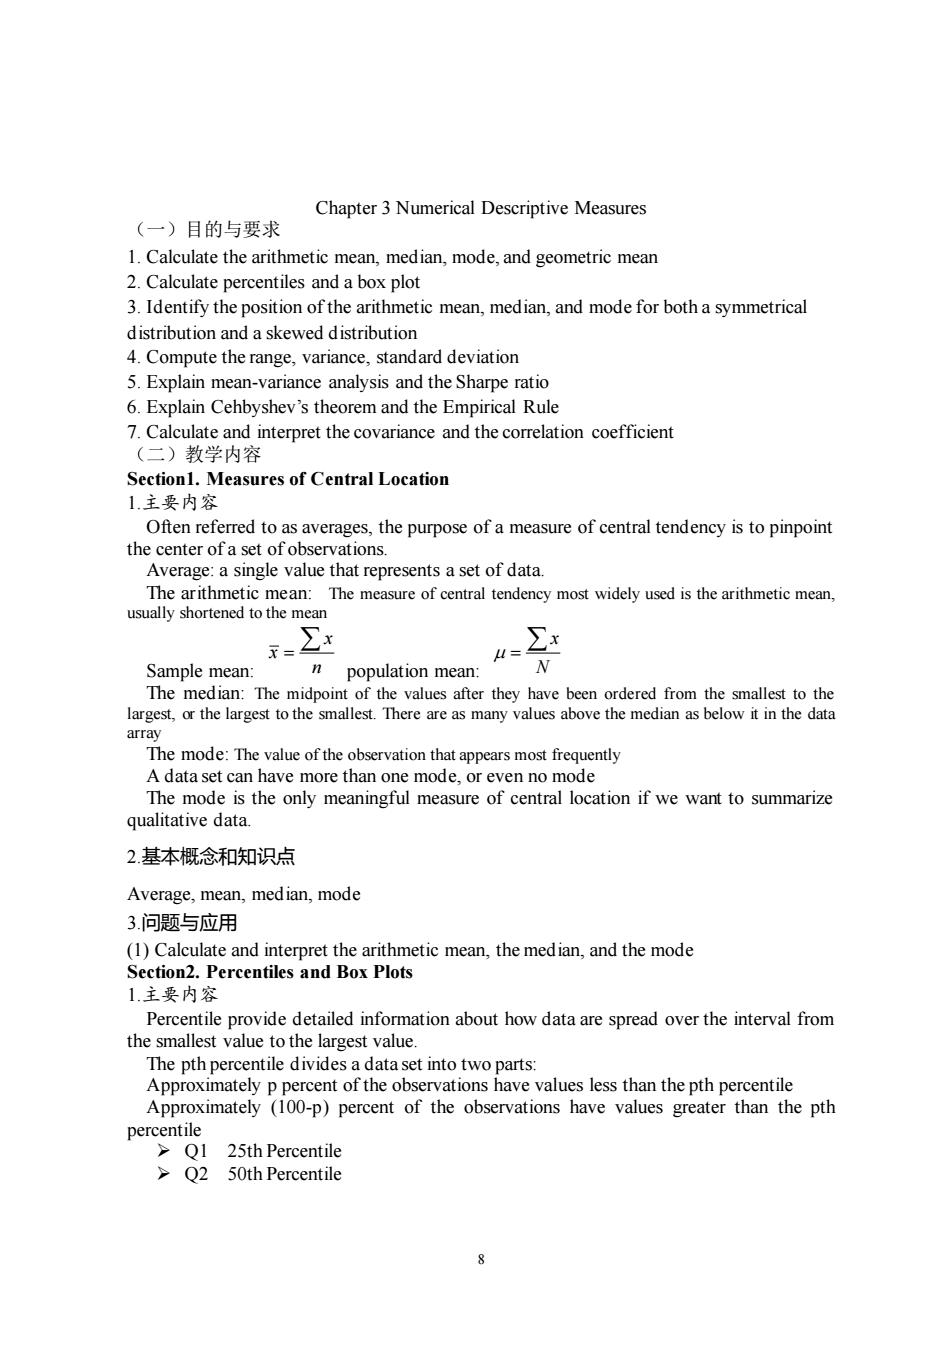
Stems Leaves Stems Leaves 026 103 Stems go hereLeaves go here 2258 3449 4 6157 Scatterplots 2.基本概念和知识点 Frequency distribution for quantitative data,histograms,polygons,ogives,Stem-and-Leaf Diagrams,scatterplots 3.问题与应用 (1)Summarize quantitative data by forming frequency distributions (2)Construct and interpret histogram,a frequency polygon,or a cumulative frequency tnditet (4)Construct and interpret a scatterplot 课程思政:要求学生完成章节作业,自己搜集案例数据,制作本章学习到的每一种图 表。培养学生一丝不苟、严谨求真的科学精神,对图表精雕细琢、精益求精的工匠精 神。 (三)思考与实践 1,掌握书上本章概念(以绿色标出): 2.完成本章书后计算题。 (四)教学方法与手段 1.教学方法:课堂讲授:课堂练习。 2.教学手段:多媒体教学
7 Scatterplots 2.基本概念和知识点 Frequency distribution for quantitative data, histograms, polygons, ogives, Stem-and-Leaf Diagrams, scatterplots 3.问题与应用 (1) Summarize quantitative data by forming frequency distributions (2) Construct and interpret histogram, a frequency polygon, or a cumulative frequency polygon. (3) Construct and interpret a stem-and-leaf display (4) Construct and interpret a scatterplot 课程思政:要求学生完成章节作业,自己搜集案例数据,制作本章学习到的每一种图 表。培养学生一丝不苟、严谨求真的科学精神,对图表精雕细琢、精益求精的工匠精 神。 (三)思考与实践 1.掌握书上本章概念(以绿色标出); 2.完成本章书后计算题。 (四)教学方法与手段 1.教学方法:课堂讲授;课堂练习。 2.教学手段:多媒体教学
Chapter 3 Numerical Descriptive Measures (一)目的与要求 1.Calculate the arithmetic mean,median,mode,and geometric mean 2.Calculate percentils and a bx plo 3.Identify the position of the arithmetic mean,median,and mode for both a symmetrical distribution and a skewed distribution 4.Compute the range.variance.standard deviation 5.Explain mean-variance analysis and the Sharpe ratio 6.Explain Cehbyshev's the orem and the Empirical Rule Calculate and interpret the covariance and the correlation coefficient (二)教学内容 Section1.Measures of Central Location 1.主要内容 Often referred to as averages,the purpose of a measure of central tendency is to pinpoint the center of a set of observations. Average:a single value that represents a set of data. The measure of central tendency most widely used is the arithmetic mean. 1 population mean The midpoir lar The mode:The value of the observation that appears most frequently A data set can have more than one mode,or even no mode uthe ony mfl of cifwe 2.基本概念和知识点 Average,mean,median,mode 3.问题与应用 (1)Calculate and interpret the arithmetic mean,the median,and the mode Section2.Percentiles and Box Plots 1主要内容 Percentile provide detailed information about how data are spread over the interval from the smallest value to the largest value. The pth percentile divides a data set into two parts: Approximately p percent of the observations have values less than the pth percentile Approximately (100-p)percent of the observations have values greater than the pth Q2 50th Percentile
8 Chapter 3 Numerical Descriptive Measures (一)目的与要求 1. Calculate the arithmetic mean, median, mode, and geometric mean 2. Calculate percentiles and a box plot 3. Identify the position of the arithmetic mean, median, and mode for both a symmetrical distribution and a skewed distribution 4. Compute the range, variance, standard deviation 5. Explain mean-variance analysis and the Sharpe ratio 6. Explain Cehbyshev’s theorem and the Empirical Rule 7. Calculate and interpret the covariance and the correlation coefficient (二)教学内容 Section1. Measures of Central Location 1.主要内容 Often referred to as averages, the purpose of a measure of central tendency is to pinpoint the center of a set of observations. Average: a single value that represents a set of data. The arithmetic mean: The measure of central tendency most widely used is the arithmetic mean, usually shortened to the mean Sample mean: x x n = population mean: x N = The median: The midpoint of the values after they have been ordered from the smallest to the largest, or the largest to the smallest. There are as many values above the median as below it in the data array The mode: The value of the observation that appears most frequently A data set can have more than one mode, or even no mode The mode is the only meaningful measure of central location if we want to summarize qualitative data. 2.基本概念和知识点 Average, mean, median, mode 3.问题与应用 (1) Calculate and interpret the arithmetic mean, the median, and the mode Section2. Percentiles and Box Plots 1.主要内容 Percentile provide detailed information about how data are spread over the interval from the smallest value to the largest value. The pth percentile divides a data set into two parts: Approximately p percent of the observations have values less than the pth percentile Approximately (100-p) percent of the observations have values greater than the pth percentile ➢ Q1 25th Percentile ➢ Q2 50th Percentile
75th Percentile IQR interquartile range Q3-Q1 Box plot F排名 25%Q1 50%Q2 75%Q3 100%Q4 2.基本概念和知识点 Percentiles,Box Plots 3.问题与应用 (1)Calculate 1主要内容 The G.M.=)) The average growth rate. Geometric Mean Return Ge=1+R1+R)(1+R,)-1 Geometric Mean Growth Rate G=1+g1+g,).(1+g)-1 2基本概念和知识点 Geometric mean,Geometric Mean Retum,Geometric Mean Growth Rate 3.问题与应用 (1)Calculate and interpret a geometric mean return and an average growth rate Section4.Measures of Dispersion 1.主要内容 Range=Highest value-Lowest value The mean absolute deviation:the arithmetic mean of the absolute values of the deviations from the arithmetic mean Sample MAD=∑E-Population MAD=∑K-L The variance and the standard deviation Variance:the arithmetic mean ofthe squared deviations from the mean
9 ➢ Q3 75th Percentile ➢ IQR interquartile range Q3-Q1 Box plot: 2.基本概念和知识点 Percentiles, Box Plots 3.问题与应用 (1) Calculate and interpret the percentiles and box plots Section3. The Geometric Mean 1.主要内容 The geometric mean return: the geometric mean of a set of n positive numbers is defined as the nth root of the product of the n numbers G.M. ( )( )( ) ( ) 1 2 3 n n = x x x x The average growth rate: Geometric Mean Return G (1 )(1 ) (1 ) 1 1 2 n R n = + + + − R R R Geometric Mean Growth Rate G (1 )(1 ) (1 ) 1 1 2 n g n = + + + − g g g 2.基本概念和知识点 Geometric mean, Geometric Mean Return, Geometric Mean Growth Rate 3.问题与应用 (1) Calculate and interpret a geometric mean return and an average growth rate Section4. Measures of Dispersion 1.主要内容 Range= Highest value – Lowest value The mean absolute deviation: the arithmetic mean of the absolute values of the deviations from the arithmetic mean | | Sample MAD i x x n − = , | | Population MAD i x N − = The variance and the standard deviation Variance: the arithmetic mean of the squared deviations from the mean

Sample CV=5 Population CV= 2.基本概念和知识点 Range,MAD,variance,standard deviation,the coefficient of variance 3.问题与应用 (1)Calculate and interpret the ean-Variance Analy 1.主要内容 Mean-Variance analysis:In some instances,analysis entails comparing two or more data sets that have different means or units of measurement.The coefficient of variation(CV) serves as arelative measure of dispersion and adjusts for differences in the magnitudes of the mean Calculated by dividing a data set's standard deviation by its mean,CV is a unitless measure that allows fordirect comparisons of mean-adjusted dispersion across different data sets. Sample CV Population CV= Sharpe ratio:the extra reward per unit of risk X-R 2.基本概念和知识点 Mean-Variance analysis,Sharpe ratio 3问题与应用 (1)Explain Mean-Varian alysis and the sha Sectio.ChebysheTheorem and the Empirical Rule 1主要内容 Chebyshev'sTheorem As we will see in more detail in later chapters,it is important to be able to use the standard deviation to make statements about the proportion of observations that fall within certain intervals.Fortunately,a Russian mathematician Pavroty Chebyshev(1821-1894)found bounds for the proportion of the data that lie within a specified number of standard deviations from the mean (apply to all data sets) For any set of observations (sample or population),the minimum proportion of the values that lie within k standard deviations of the mean is at least 1-1/k2,where k is any constant 10
10 Standard deviation: the square root of the variance The coefficient of variance Sample CV s x = , Population CV = 2.基本概念和知识点 Range, MAD, variance, standard deviation, the coefficient of variance 3.问题与应用 (1) Calculate and interpret the range, MAD, variance, standard deviation Section5. Mean-Variance Analysis and the Sharpe Ratio 1.主要内容 Mean-Variance analysis: In some instances, analysis entails comparing two or more data sets that have different means or units of measurement. The coefficient of variation ( CV) serves as a relative measure of dispersion and adjusts for differences in the magnitudes of the means. Calculated by dividing a data set’s standard deviation by its mean, CV is a unitless measure that allows for direct comparisons of mean-adjusted dispersion across different data sets. Sample CV s x = Population CV = Sharpe ratio: the extra reward per unit of risk I f I x R s − 2.基本概念和知识点 Mean-Variance analysis, Sharpe ratio 3.问题与应用 (1) Explain Mean-Variance analysis and the Sharpe ratio Section6. Chebyshev’s Theorem and the Empirical Rule 1.主要内容 Chebyshev’s Theorem As we will see in more detail in later chapters, it is important to be able to use the standard deviation to make statements about the proportion of observations that fall within certain intervals. Fortunately, a Russian mathematician Pavroty Chebyshev (1821–1894) found bounds for the proportion of the data that lie within a specified number of standard deviations from the mean. (apply to all data sets) For any set of observations (sample or population), the minimum proportion of the values that lie within k standard deviations of the mean is at least 1-1/k2 , where k is any constant