Portfolio Mean and Variance Diagram of a Portfolio Consider two assets as indicated in the following figure. e=-1 o Introduce a variable a.Define w=1-a and w2=a.As a varies, the new portfolios trace out a curve that includes assets 1 and 2 but its exact shape depends on 012. The solid portion of the curve corresponds to positive combinations of two assets;the dashed portion corresponds to shorting one of them. o The solid portion of the curve must lie within the shaded region. Xi CHEN (chenxi0109@bfsu.edu.cn) Investment Science 17/81
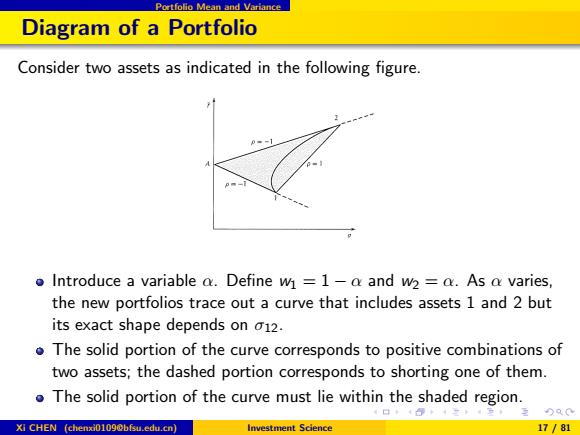
Portfolio Mean and Variance Diagram of a Portfolio Consider two assets as indicated in the following figure. Introduce a variable α. Define w1 = 1 − α and w2 = α. As α varies, the new portfolios trace out a curve that includes assets 1 and 2 but its exact shape depends on σ12. The solid portion of the curve corresponds to positive combinations of two assets; the dashed portion corresponds to shorting one of them. The solid portion of the curve must lie within the shaded region. Xi CHEN (chenxi0109@bfsu.edu.cn) Investment Science 17 / 81
Portfolio Mean and Variance Lemma (Portfolio diagram lemma) The curve in an T-a diagram defined by nonnegative mixtures of two assets 1 and 2 lies within the triangular region defined by the two original assets and the point on the vertical axis of height A= T102+T201 01+02 Proof. The mean of the rate of return of the portfolio is r(a)=(1-)71+aT2. which indicates that the mean value is between the original means.The standard deviation of the portfolio is a(r(a)=V(1-a2a+2a(1-a)o12+a2 =V(1-a)2o1+2pa(1-a)102+a2 XⅪCHEN(chenxt0l09 Dbfsu.edu.cn】 Investment Science 18/81
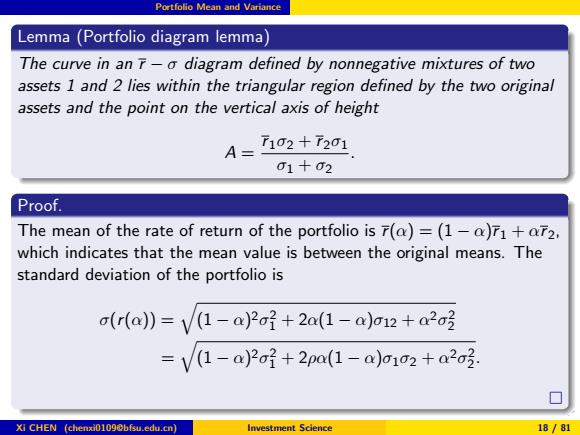
Portfolio Mean and Variance Lemma (Portfolio diagram lemma) The curve in an r − σ diagram defined by nonnegative mixtures of two assets 1 and 2 lies within the triangular region defined by the two original assets and the point on the vertical axis of height A = r 1σ2 + r 2σ1 σ1 + σ2 . Proof. The mean of the rate of return of the portfolio is r(α) = (1 − α)r 1 + αr 2, which indicates that the mean value is between the original means. The standard deviation of the portfolio is σ(r(α)) = q (1 − α) 2σ 2 1 + 2α(1 − α)σ12 + α2σ 2 2 = q (1 − α) 2σ 2 1 + 2ρα(1 − α)σ1σ2 + α2σ 2 2 . Xi CHEN (chenxi0109@bfsu.edu.cn) Investment Science 18 / 81
Portfolio Mean and Variance contd. We know that pE[-1,1].Using p=1,we have the upper bound a*(r(a)=(1-a)1+ao2. This implies that as a varies from 0 to 1,the portfolio point will trace out a straight line between the two points.Using p=-1,we likewise obtain the lower bound o,((a)=V(1-a2o1-2a(1-a)1o2+a2a3 =l(1-a)o1-ao2: It is nearly linear as well,except for the absolute-value sign.Then Q=- 1→A=102+720 1+02 01+2 Xi CHEN (chenxi0109@bfsu.edu.cn) Investment Science 19/81
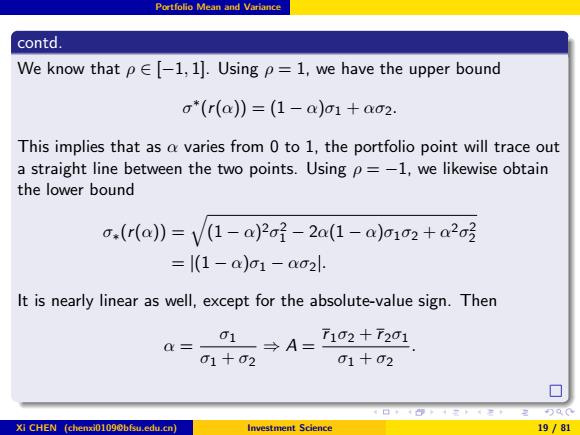
Portfolio Mean and Variance contd. We know that ρ ∈ [−1, 1]. Using ρ = 1, we have the upper bound σ ∗ (r(α)) = (1 − α)σ1 + ασ2. This implies that as α varies from 0 to 1, the portfolio point will trace out a straight line between the two points. Using ρ = −1, we likewise obtain the lower bound σ∗(r(α)) = q (1 − α) 2σ 2 1 − 2α(1 − α)σ1σ2 + α2σ 2 2 = |(1 − α)σ1 − ασ2|. It is nearly linear as well, except for the absolute-value sign. Then α = σ1 σ1 + σ2 ⇒ A = r 1σ2 + r 2σ1 σ1 + σ2 . Xi CHEN (chenxi0109@bfsu.edu.cn) Investment Science 19 / 81
The Feasible Set Outline Asset Return Random Variables (self-learning) Random Returns (self-learning) Portfolio Mean and Variance ⑤The Feasible Set The Markowitz Model The Two-Fund Theorem Inclusion of a Risk-Free Asset The One-Fund Theorem 4口40+4三4至,至)只0 Xi CHEN (chenxi0109@bfsu.edu.cn) Investment Science 20/81
The Feasible Set Outline 1 Asset Return 2 Random Variables (self-learning) 3 Random Returns (self-learning) 4 Portfolio Mean and Variance 5 The Feasible Set 6 The Markowitz Model 7 The Two-Fund Theorem 8 Inclusion of a Risk-Free Asset 9 The One-Fund Theorem Xi CHEN (chenxi0109@bfsu.edu.cn) Investment Science 20 / 81
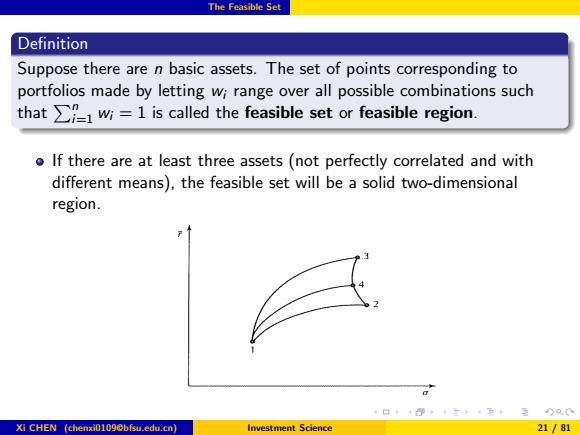
The Feasible Set Definition Suppose there are n basic assets.The set of points corresponding to portfolios made by letting wi range over all possible combinations such thatwi=1 is called the feasible set or feasible region. o If there are at least three assets(not perfectly correlated and with different means),the feasible set will be a solid two-dimensional region. Xi CHEN (chenxi0109@bfsu.edu.cn) Investment Science 21/81
The Feasible Set Definition Suppose there are n basic assets. The set of points corresponding to portfolios made by letting wi range over all possible combinations such that Pn i=1 wi = 1 is called the feasible set or feasible region. If there are at least three assets (not perfectly correlated and with different means), the feasible set will be a solid two-dimensional region. Xi CHEN (chenxi0109@bfsu.edu.cn) Investment Science 21 / 81