同济经管 TONGJI SEM CHAPTER 7 CHOOSING INNOVATION PROJECTS -----Choosing innovation projects in which to invest,including both quantitative and qualitative valuation techniques EFMC EQUIS
CHAPTER 7 CHOOSING INNOVATION PROJECTS -----Choosing innovation projects in which to invest, including both quantitative and qualitative valuation techniques
同济经管 Overview TONGJI SEM Methods of choosing innovation projects range from informal to highly structured,and from entirely qualitative to strictly quantitative. Often firms use a combination of method to more completely evaluate the potential(and risk)of an innovation project. EQUIS 1
17 Overview Methods of choosing innovation projects range from informal to highly structured, and from entirely qualitative to strictly quantitative. Often firms use a combination of method to more completely evaluate the potential (and risk) of an innovation project
同济经管 The Development Budget TONGJI SEM -Most firms face serious constraints in capital and other resources they can invest in projects -Firms thus often use capital rationing:they set a fixed R&D budget and rank order projects to support. -R&D budget is often a percentage of previous year's sales. -Percentage is typically determined through industry benchmarking. or historical benchmarking of firm's performance. EQUIS 18
18 The Development Budget Most firms face serious constraints in capital and other resources they can invest in projects. Firms thus often use capital rationing: they set a fixed R&D budget and rank order projects to support. – R&D budget is often a percentage of previous year’s sales. – Percentage is typically determined through industry benchmarking, or historical benchmarking of firm’s performance
同济经管 The Development Budget TONGJI SEM R&D Intensity varies considerably across and within industries. Industry R&D as a Percent of Sales Software Internet 12.7% Health 11.2 Computing Electronics 7.6 Technology 43 Aerospace Defense 4.1 Automotive 41 Industrials 2.3 Consumer Products 2.1 VERSITY Telecom 1.9 Chemicals Energy 1.5 EOUIS 19
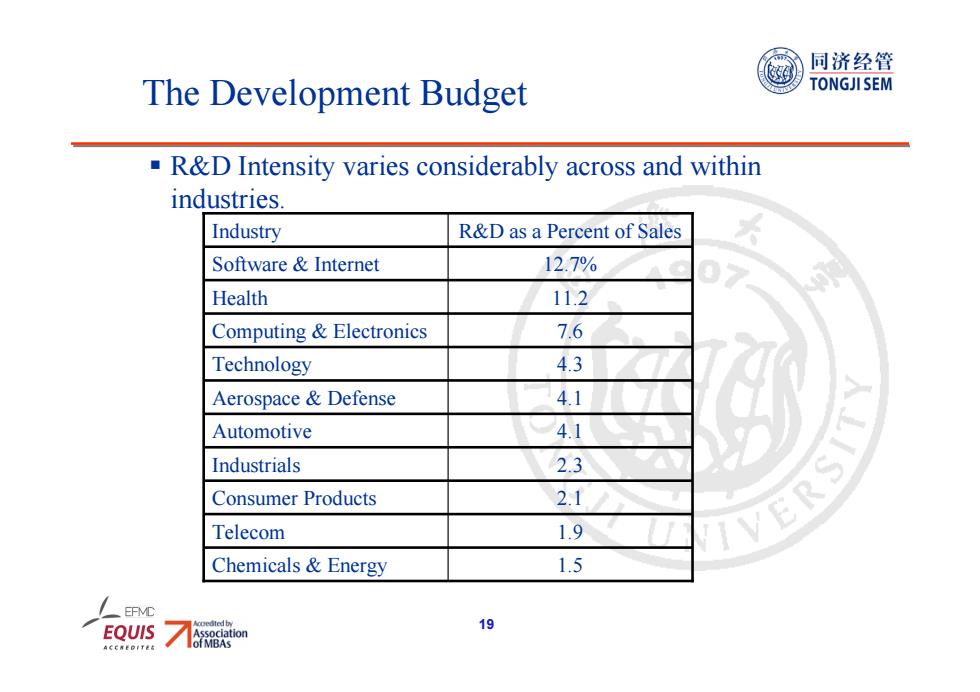
19 The Development Budget R&D Intensity varies considerably across and within industries. Industry R&D as a Percent of Sales Software & Internet 12.7% Health 11.2 Computing & Electronics 7.6 Technology 4.3 Aerospace & Defense 4.1 Automotive 4.1 Industrials 2.3 Consumer Products 2.1 Telecom 1.9 Chemicals & Energy 1.5
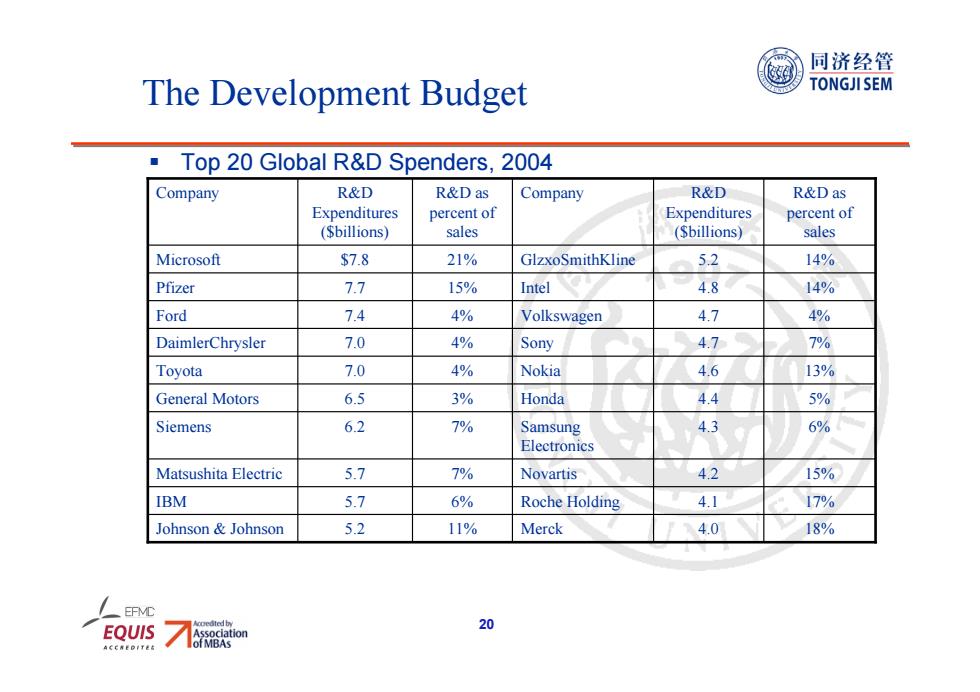
同济经管 The Development Budget TONGJI SEM Top 20 Global R&D Spenders,2004 Company R&D R&D as Company R&D R&D as Expenditures percent of Expenditures percent of (Sbillions) sales (Sbillions) sales Microsoft $7.8 21% GlzxoSmithKline 5.2 14% Pfizer 7.7 15% Intel 4.8 14% Ford 7.4 4% Volkswagen 4.7 4% DaimlerChrysler 7.0 4% Sony 4.7 7% Toyota 7.0 4% Nokia 4.6 13% General Motors 6.5 3% Honda 4.4 5% Siemens 6.2 7% Samsung 4.3 6% Electronics Matsushita Electric 5.7 7% Novartis 4.2 15% IBM 5.7 6% Roche Holding 4.1 17% Johnson Johnson 5.2 11% Merck 4.0 18% /EFMC EOUIS 20
20 The Development Budget Top 20 Global R&D Spenders, 2004 18% 17% 15% 6% 5% 13% 7% 4% 14% 14% R&D as percent of sales 4.0 4.1 4.2 4.3 4.4 4.6 4.7 4.7 4.8 5.2 R&D Expenditures ($billions) Merck Roche Holding Novartis Samsung Electronics Honda Nokia Sony Volkswagen Intel GlzxoSmithKline Company Johnson & Johnson 5.2 11% IBM 5.7 6% Matsushita Electric 5.7 7% Siemens 6.2 7% General Motors 6.5 3% Toyota 7.0 4% DaimlerChrysler 7.0 4% Ford 7.4 4% Pfizer 7.7 15% Microsoft $7.8 21% R&D as percent of sales R&D Expenditures ($billions) Company