A simple modelfor an increasing specific growth rate during a lag phase is ='mx(-exp(-tt》 tL (h):the constant related to the length of the lag phase
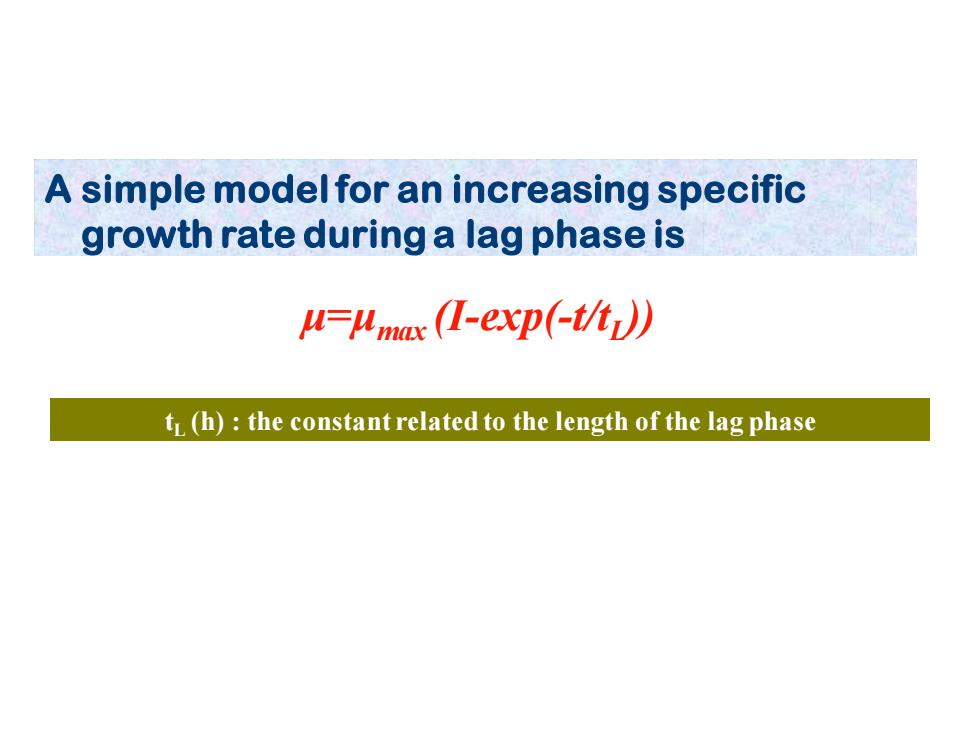
A simple model for an increasing specific growth rate during a lag phase is μ=μmax (I-exp(-t/tL )) tL (h) : the constant related to the length of the lag phase
dx dt =uX d dt =-4X dDOT=Kia(DOT *-DOT)-qoXH dt dp=qox dt
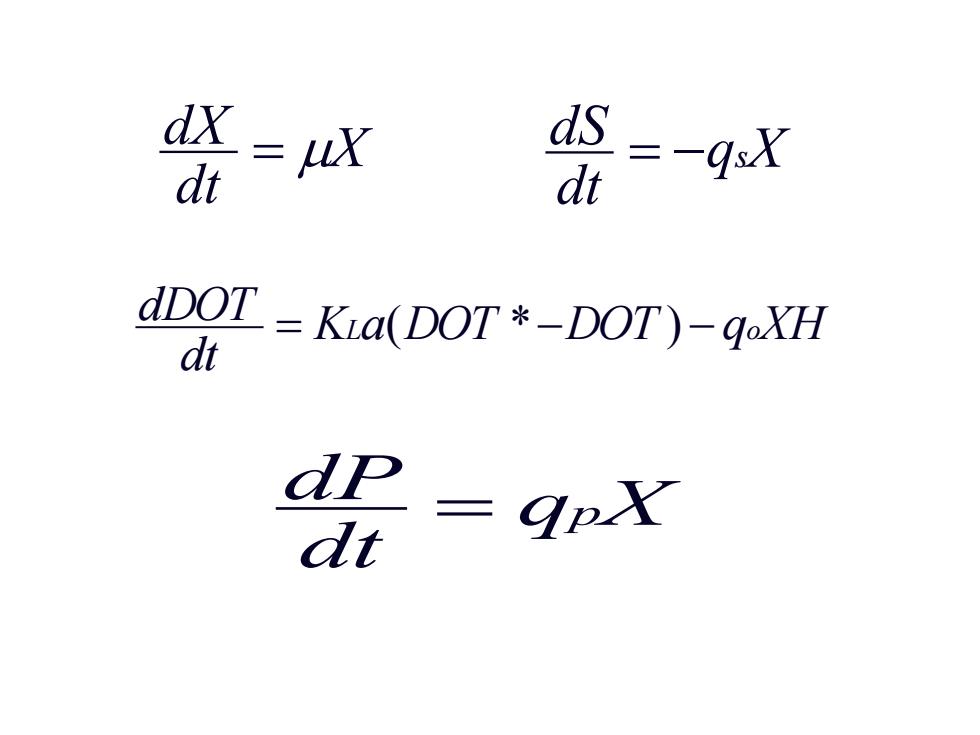
X dt dX = q X dt dS = − s K a DOT DOT q XH dt dDOT = L ( *− ) − o q X dt dP = p

10 20 100 D01 216012nS (8)100 0 of 0 -0.5 ogx DOT Time (h) 10 Simulation of batch processes onentially until the C/energy substrate(S) 18℃0n气2<4 Constants used:qs.max=I h1:Ks.s=0.05 kg m-3:Ks.o=5 air sat; Yx/s 0.5 kg:Yo/s=0.5 kg kg-1.KLa 500 h-1 (250 h-1 in the middle curve)

6.2.Continuous fermentation F (1-6y F2 8y Classification of continuous processes based on the flow patter.Left:Single stag Middle:Single stage with recirculation;Right:Two stage with optional two stream medium
6.2. Continuous fermentation
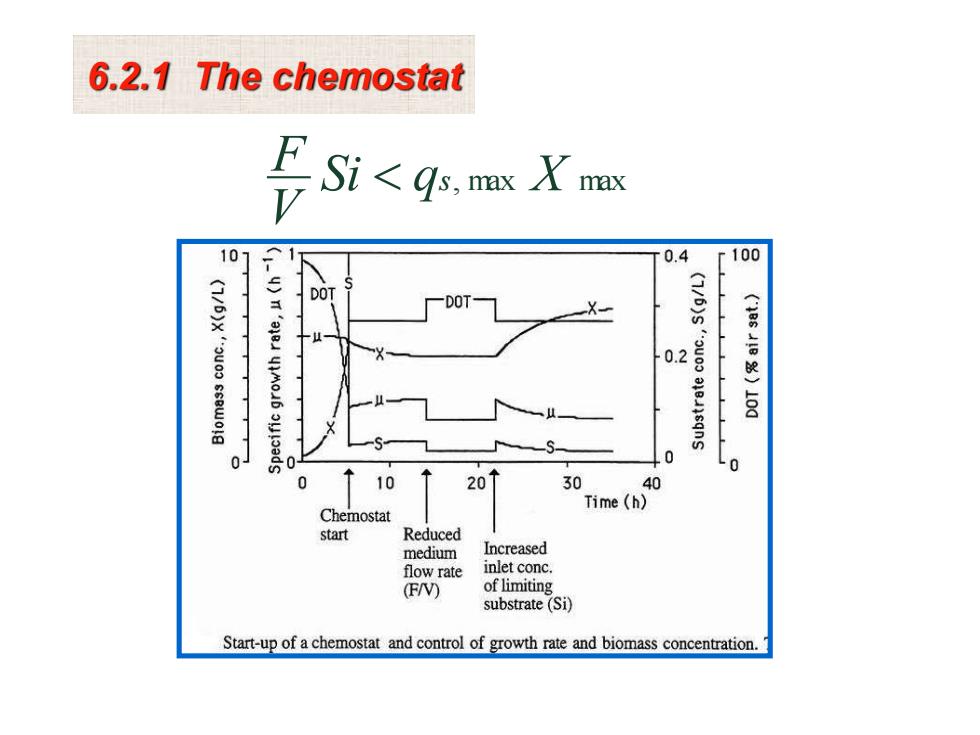
6.2.1 The chemostat Si<qs,mx X max 101 0.4 r100 DOT DOT- X 0.2 (3=51m5)101 0 0 Lo 0 10 20 30 40 Time (h) Chemostat start Reduced medium Increased flow rate inlet conc (F/V) of limiting substrate (Si) Start-up of a chemostat and control of growth rate and biomass concentration
Si q , max X max V F s 6.2.1 The chemostat