The Auto-Regressive (AR)technique for Coding Region Prediction 1 H(z)= 1+a2 02 P(k)= E where o2 is the variance of w(n)and w=ei(z/N)
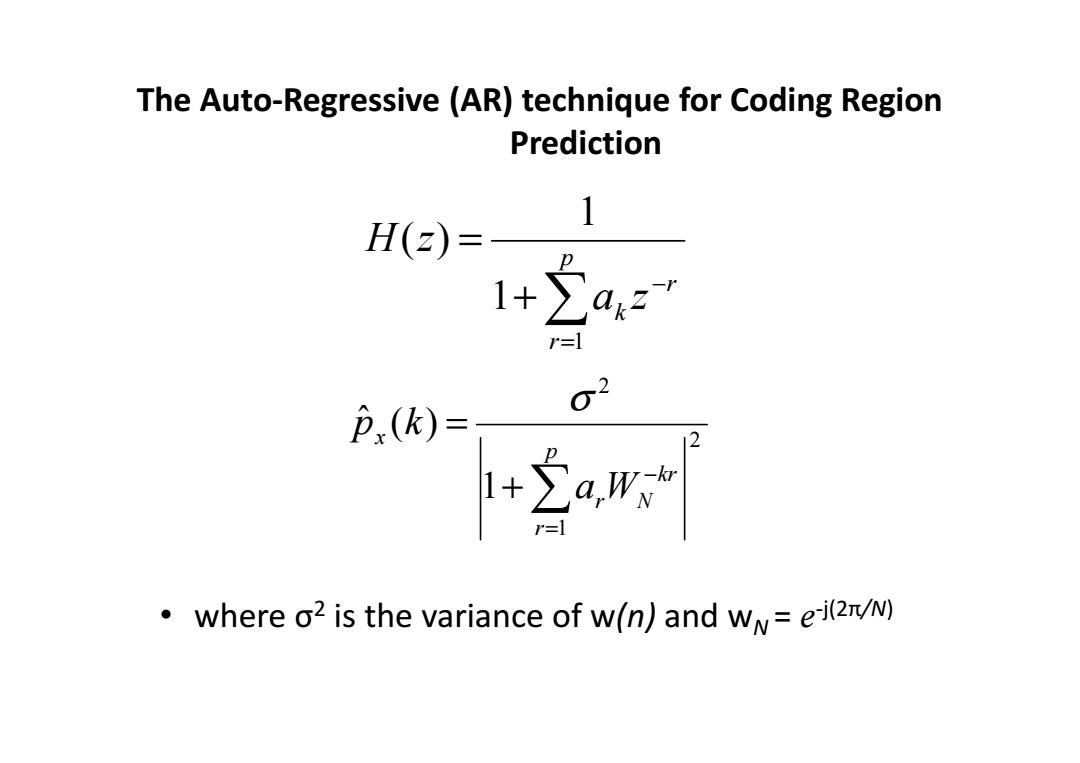
The Auto-Regressive (AR) technique for Coding Region Prediction • where σ 2 is the variance of w(n) and w N = e -j(2π/N) ∑= − + = p r r k a z H z 1 1 1 ( ) 2 1 2 1 ˆ ( ) kr N p r r x a W p k − = + ∑ = σ
Experimental Scheme The spectral analysis methods have been applied to various genomic sequences from several different organisms and the results compared: Fast Fourier Transform(FFT)periodogram, AR model using the Burg algorithm with p=30(called Burg 1) AR model using the Burg algorithm with p=50(called Burg 2) AR model based on the improved covariance analysis with p=30 (called Cov.1) AR model based on the improved covariance analysis with p=50 (called Cov.2)
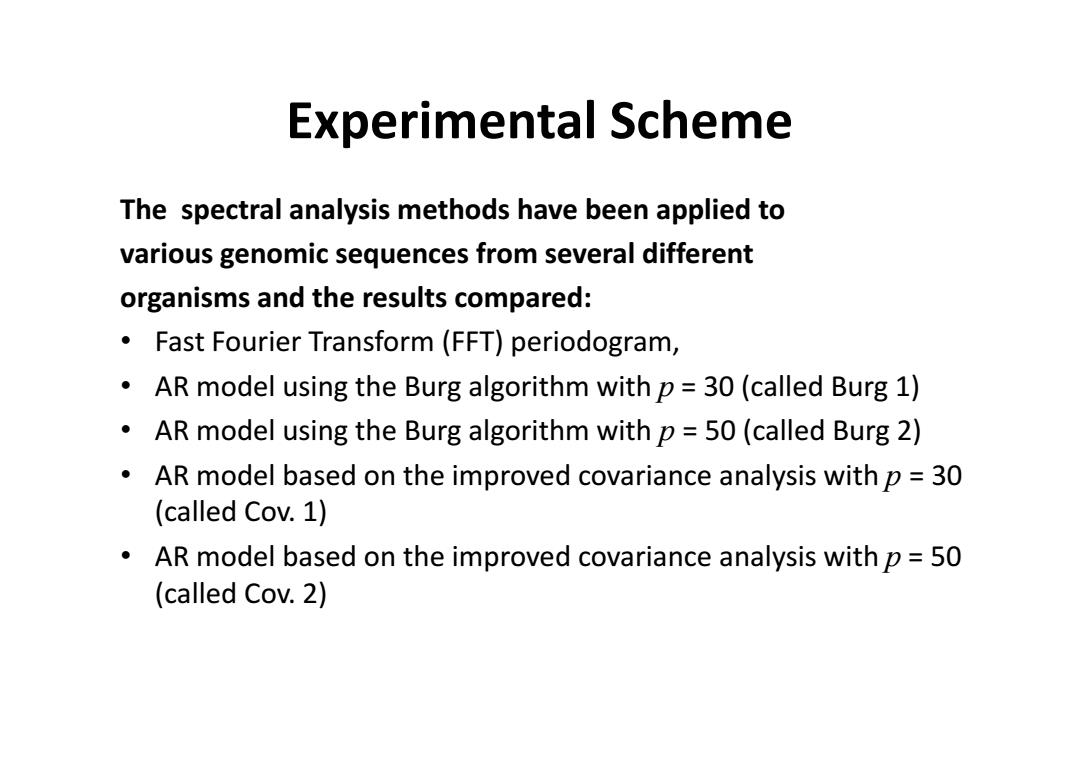
Experimental Scheme The spectral analysis methods have been applied to various genomic sequences from several different organisms and the results compared: • Fast Fourier Transform (FFT) periodogram, • AR model using the Burg algorithm with p = 30 (called Burg 1) • AR model using the Burg algorithm with p = 50 (called Burg 2) • AR model based on the improved covariance analysis with p = 30 (called Cov. 1) • AR model based on the improved covariance analysis with p = 50 (called Cov. 2)
Experimental Scheme In order to assess and compare the different methods,the local signal to noise ratio P(dB)is defined as: 10*1gs,(3) P= S1
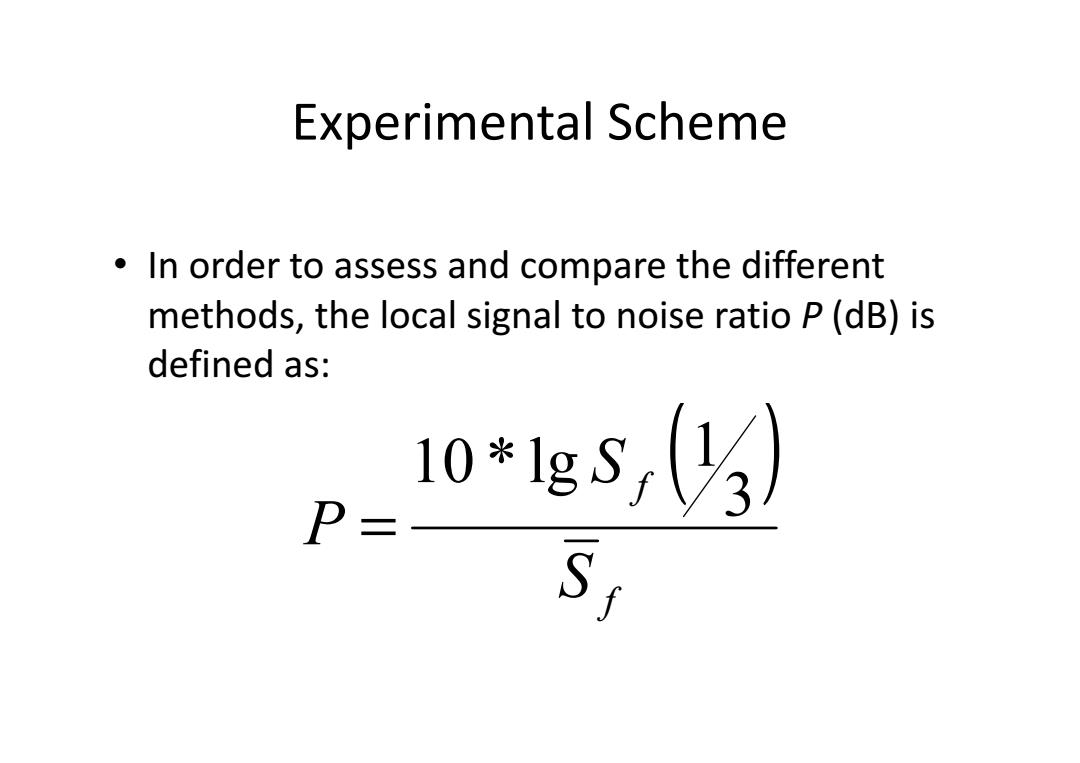
Experimental Scheme • In order to assess and compare the different methods, the local signal to noise ratio P (dB) is defined as: ( ) f f S S P 3 1 10 * lg =

Experimental Results ·Large DNA sequences (more than 10000 base pairs) Method I FFT Burgl B12 Co.1 Cov.2 F 5.0048 6.80869.54296.79919.5431
Experimental Results • Large DNA sequences (more than 10000 base pairs )
Experimental Results ·Medium DNA sequences (between 3000 and 10000 base pairs) Method FFT Burgl Bug2 Cov.1 Cov.2 P 281487.834010.81077.758310.6904
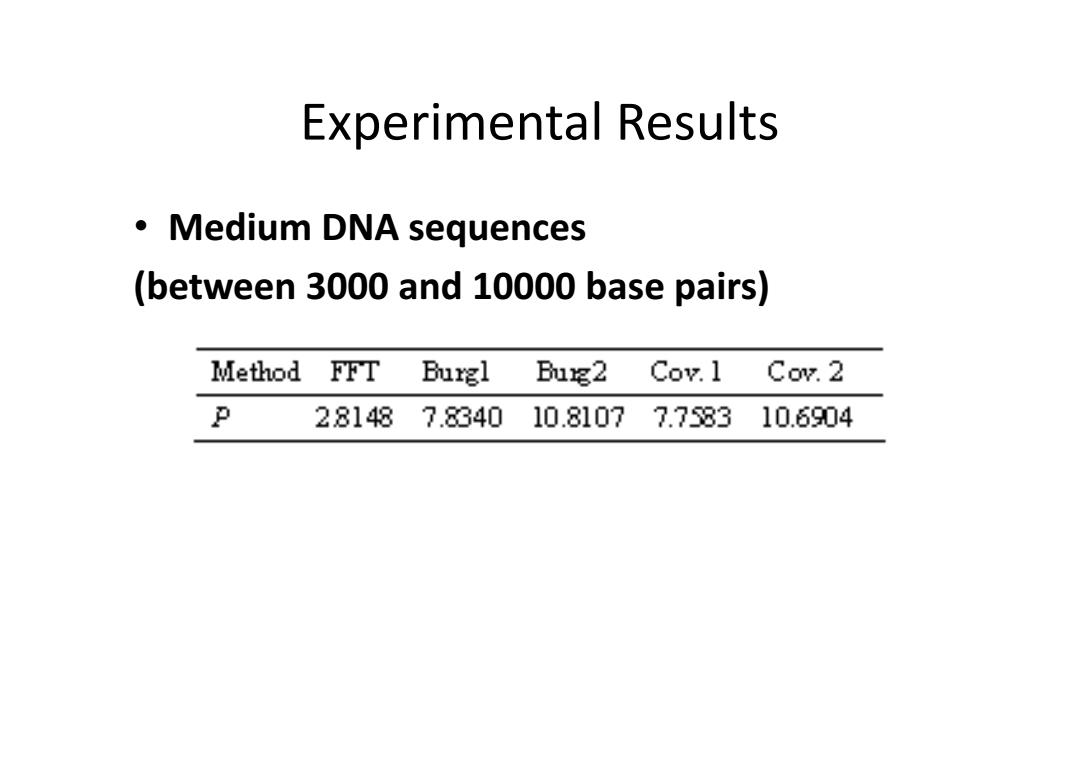
Experimental Results • Medium DNA sequences (between 3000 and 10000 base pairs)