Lecture 4-2 Biomedical Applications of AR Model Prof.N Rao
Lecture 4-2 Biomedical Applications of AR Model Prof. N Rao

The Auto-Regressive (AR)technique for Spectral Analysis A numerical example: (n)=√2cos(2π(0.1)n)+V2cos(2π(0.13)n)+o(n) where n=0,1,...,(N-1)and w(n)is white Gaussian noise with variance 10-. Taking N=19
The Auto-Regressive (AR) technique for Spectral Analysis A numerical example: where n = 0,1,…, (N-1) and ω ( n) is white Gaussian noise with variance = 10-6 . Taking N = 19. x ( n ) = 2 cos( 2 π ( 0.1 ) n ) + 2 cos( 2 π ( 0.13 ) n ) + ω( n )
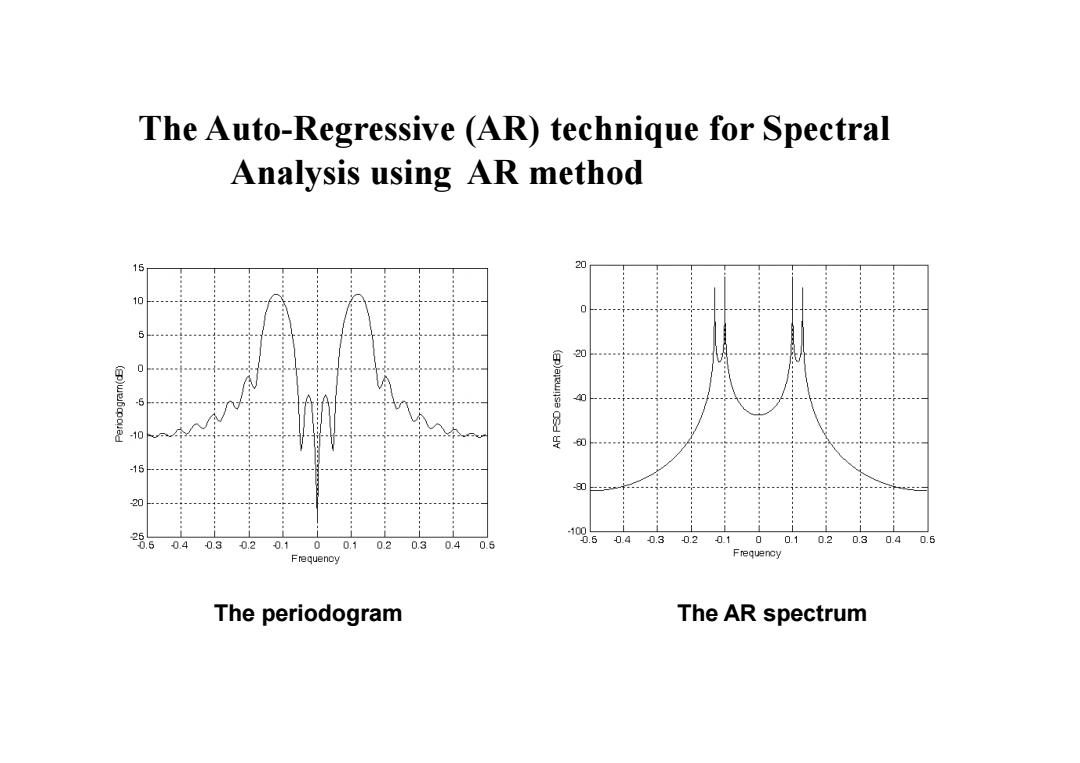
The Auto-Regressive (AR)technique for Spectral Analysis using aR method 15 20 10 1 -100 0.50.40.3 0.2 00.10.20.30.40.5 0.4 0.3 0.2 0.1 0 0.1 0.2 0.30.40.6 01 Frequenoy Frequency The periodogram The AR spectrum
The Auto-Regressive (AR) technique for Spectral Analysis using AR method The periodogram The AR spectrum
It can clearly be seen from Figure 1 that the AR technique exhibits superior resolution.It has distinguished the two sinusoids even though they are very closely spaced in frequency. The periodogram cannot resolve the signals because their spacing is 0.03 cycles/sample which would require a data record of at least N=1/0.03 34 points. In addition,note the smoothness of the AR spectrum which exhibits fewer random fluctuations due to noise and statistical estimation errors as well as an absence of sidelobes.Having justified the advantages of the AR model,we now describe it and its use
• It can clearly be seen from Figure 1 that the AR technique exhibits superior resolution. It has distinguished the two sinusoids even though they are very closely spaced in frequency. • The periodogram cannot resolve the signals because their spacing is 0.03 cycles/sample which would require a data record of at least N = 1/0.03 = 34 points. • In addition, note the smoothness of the AR spectrum which exhibits fewer random fluctuations due to noise and statistical estimation errors as well as an absence of sidelobes. Having justified the advantages of the AR model, we now describe it and its use
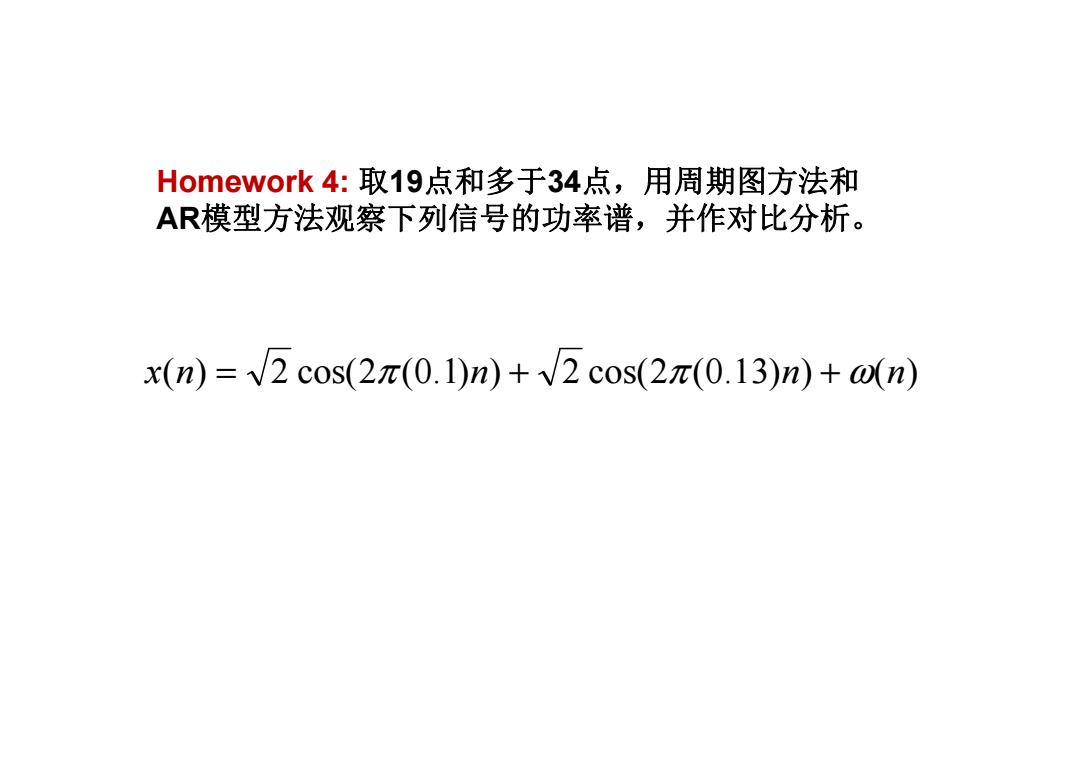
Homework4:取19点和多于34点,用周期图方法和 AR模型方法观察下列信号的功率谱,并作对比分析。 x(n)=V2cos(2π(0.1)n)+√2cos(2π(0.13)n)+on)
x(n) = 2 cos(2π (0.1)n) + 2 cos(2π (0.13)n) + ω(n) Homework 4: 取19点和多于34点,用周期图方法和 AR模型方法观察下列信号的功率谱,并作对比分析