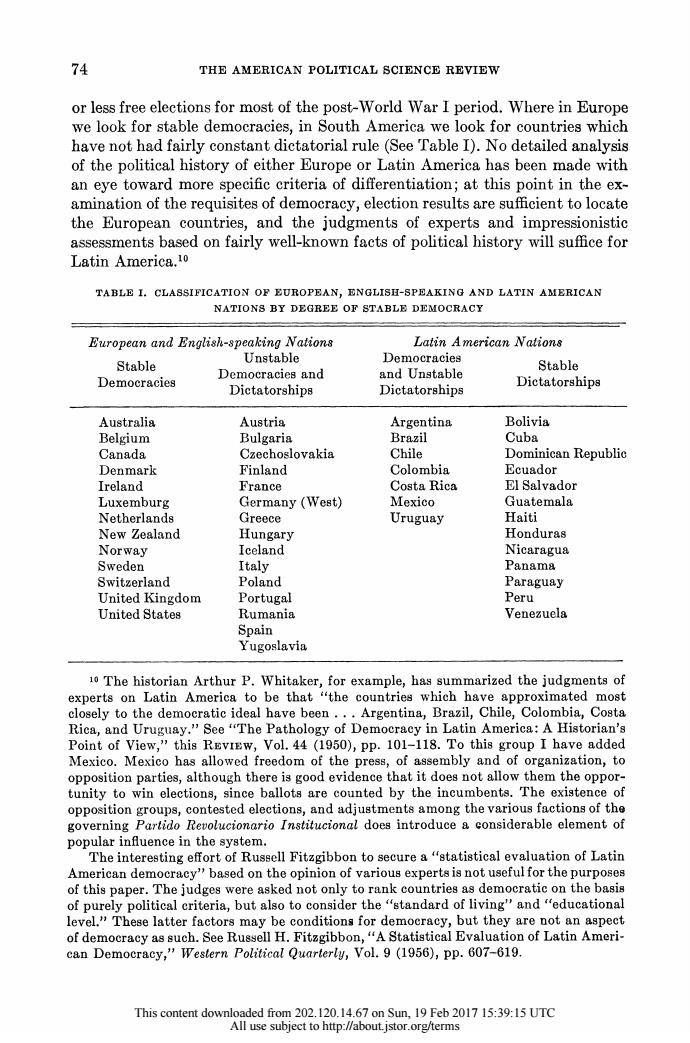
74 THE AMERICAN POLITICAL SCIENCE REVIEW or less free elections for most of the post-World War I period.Where in Europe we look for stable democracies,in South America we look for countries which have not had fairly constant dictatorial rule(See Table I).No detailed analysis of the political history of either Europe or Latin America has been made with an eye toward more specific criteria of differentiation;at this point in the ex- amination of the requisites of democracy,election results are sufficient to locate the European countries,and the judgments of experts and impressionistic assessments based on fairly well-known facts of political history will suffice for Latin America.10 TABLE I.CLASSIFICATION OF EUROPEAN,ENGLISH-SPEAKING AND LATIN AMERICAN NATIONS BY DEGREE OF STABLE DEMOCRACY European and English-speaking Nations Latin American Nations Unstable Democracies Stable Stable Democracies and and Unstable Democracies Dictatorships Dictatorships Dictatorships Australia Austria Argentina Bolivia Belgium Bulgaria Brazil Cuba Canada Czechoslovakia Chile Dominican Republic Denmark Finland Colombia Ecuador Ireland France Costa Rica El Salvador Luxemburg Germany (West) Mexico Guatemala Netherlands Greece Uruguay Haiti New Zealand Hungary Honduras Norway Iceland Nicaragua Sweden Italy Panama Switzerland Poland Paraguay United Kingdom Portugal Peru United States Rumania Venezuela Spain Yugoslavia 10 The historian Arthur P.Whitaker,for example,has summarized the judgments of experts on Latin America to be that "the countries which have approximated most closely to the democratic ideal have been...Argentina,Brazil,Chile,Colombia,Costa Rica,and Uruguay."See "The Pathology of Democracy in Latin America:A Historian's Point of View,"this REvIEw,Vol.44 (1950),pp.101-118.To this group I have added Mexico.Mexico has allowed freedom of the press,of assembly and of organization,to opposition parties,although there is good evidence that it does not allow them the oppor- tunity to win elections,since ballots are counted by the incumbents.The existence of opposition groups,contested elections,and adjustments among the various factions of the governing Partido Revolucionario Institucional does introduce a considerable element of popular influence in the system. The interesting effort of Russell Fitzgibbon to secure a"statistical evaluation of Latin American democracy"based on the opinion of various experts is not useful for the purposes of this paper.The judges were asked not only to rank countries as democratic on the basis of purely political criteria,but also to consider the "standard of living"and "educational level."These latter factors may be conditions for demoeracy,but they are not an aspect of democracy as such.See Russell H.Fitzgibbon,"A Statistical Evaluation of Latin Ameri- can Democracy,"Western Political Quarterly,Vol.9 (1956),pp.607-619. This content downloaded from 202.120.14.67 on Sun,19 Feb 2017 15:39:15 UTC All use subject to http://about.istor.org/terms
74 THE AMERICAN POLITICAL SCIENCE REVIEW or less free elections for most of the post-World War I period. Where in Europe we look for stable democracies, in South America we look for countries which have not had fairly constant dictatorial rule (See Table I). No detailed analysis of the political history of either Europe or Latin America has been made with an eye toward more specific criteria of differentiation; at this point in the ex- amination of the requisites of democracy, election results are sufficient to locate the European countries, and the judgments of experts and impressionistic assessments based on fairly well-known facts of political history will suffice for Latin America.'0 TABLE I. CLASSIFICATION OF EUROPEAN, ENGLISH-SPEAKING AND LATIN AMERICAN NATIONS BY DEGREE OF STABLE DEMOCRACY European and English-speaking Nations Latin American Nations Stable Unstable Democracies Stable Stmocables Democracies and and Unstable Stable Dictatorships Dictatorships Australia Austria Argentina Bolivia Belgium Bulgaria Brazil Cuba Canada Czechoslovakia Chile Dominican Republic Denmark Finland Colombia Ecuador Ireland France Costa Rica El Salvador Luxemburg Germany (West) Mexico Guatemala Netherlands Greece Uruguay Haiti New Zealand Hungary Honduras Norway Iceland Nicaragua Sweden Italy Panama Switzerland Poland Paraguay United Kingdom Portugal Peru United States Rumania Venezuela Spain Yugoslavia 10 The historian Arthur P. Whitaker, for example, has summarized the judgments of experts on Latin America to be that "the countries which have approximated most closely to the democratic ideal have been . . . Argentina, Brazil, Chile, Colombia, Costa Rica, and Uruguay." See "The Pathology of Democracy in Latin America: A Historian's Point of View," this REVIEW, Vol. 44 (1950), pp. 101-118. To this group I have added Mexico. Mexico has allowed freedom of the press, of assembly and of organization, to opposition parties, although there is good evidence that it does not allow them the oppor- tunity to win elections, since ballots are counted by the incumbents. The existence of opposition groups, contested elections, and adjustments among the various factions of the governing Partido Revolucionario Institucional does introduce a considerable element of popular influence in the system. The interesting effort of Russell Fitzgibbon to secure a "statistical evaluation of Latin American democracy" based on the opinion of various experts is not useful for the purposes of this paper. The judges were asked not only to rank countries as democratic on the basis of purely political criteria, but also to consider the "standard of living" and "educational level." These latter factors may be conditions for democracy, but they are not an aspect of democracy as such. See Russell H. Fitzgibbon, "A Statistical Evaluation of Latin Ameri- can Democracy," Western Political Quarterly, Vol. 9 (1956), pp. 607-619. This content downloaded from 202.120.14.67 on Sun, 19 Feb 2017 15:39:15 UTC All use subject to http://about.jstor.org/terms
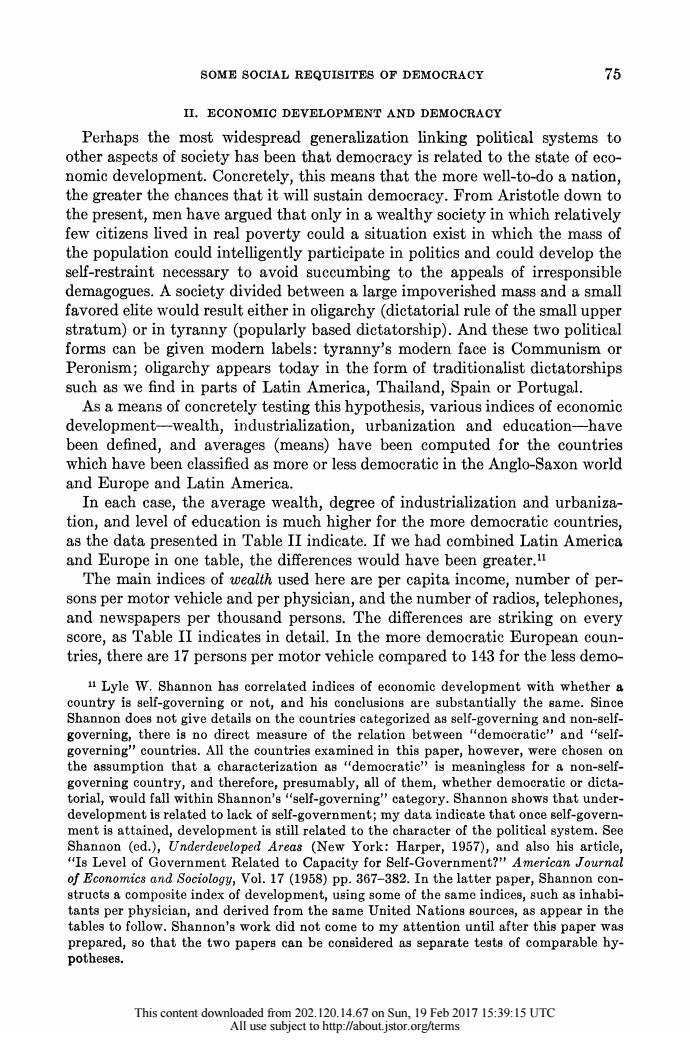
SOME SOCIAL REQUISITES OF DEMOCRACY 75 II.ECONOMIC DEVELOPMENT AND DEMOCRACY Perhaps the most widespread generalization linking political systems to other aspects of society has been that democracy is related to the state of eco- nomic development.Concretely,this means that the more well-to-do a nation, the greater the chances that it will sustain democracy.From Aristotle down to the present,men have argued that only in a wealthy society in which relatively few citizens lived in real poverty could a situation exist in which the mass of the population could intelligently participate in politics and could develop the self-restraint necessary to avoid succumbing to the appeals of irresponsible demagogues.A society divided between a large impoverished mass and a small favored elite would result either in oligarchy(dictatorial rule of the small upper stratum)or in tyranny (popularly based dictatorship).And these two political forms can be given modern labels:tyranny's modern face is Communism or Peronism;oligarchy appears today in the form of traditionalist dictatorships such as we find in parts of Latin America,Thailand,Spain or Portugal As a means of concretely testing this hypothesis,various indices of economic development-wealth,industrialization,urbanization and education-have been defined,and averages (means)have been computed for the countries which have been classified as more or less democratic in the Anglo-Saxon world and Europe and Latin America. In each case,the average wealth,degree of industrialization and urbaniza- tion,and level of education is much higher for the more democratic countries, as the data presented in Table II indicate.If we had combined Latin America and Europe in one table,the differences would have been greater. The main indices of wealth used here are per capita income,number of per- sons per motor vehicle and per physician,and the number of radios,telephones, and newspapers per thousand persons.The differences are striking on every score,as Table II indicates in detail.In the more democratic European coun- tries,there are 17 persons per motor vehicle compared to 143 for the less demo- u Lyle W.Shannon has correlated indices of economic development with whether a country is self-governing or not,and his conclusions are substantially the same.Since Shannon does not give details on the countries categorized as self-governing and non-self- governing,there is no direct measure of the relation between "democratic"and "self- governing"countries.All the countries examined in this paper,however,were chosen on the assumption that a characterization as "democratic"is meaningless for a non-self- governing country,and therefore,presumably,all of them,whether democratic or dicta- torial,would fall within Shannon's"self-governing"category.Shannon shows that under- development is related to lack of self-government;my data indicate that once self-govern- ment is attained,development is still related to the character of the political system.See Shannon (ed.),Underdeveloped Areas (New York:Harper,1957),and also his article, "Is Level of Government Related to Capacity for Self-Government?"American Journal of Economics and Sociology,Vol.17(1958)pp.367-382.In the latter paper,Shannon con- structs a composite index of development,using some of the same indices,such as inhabi- tants per physician,and derived from the same United Nations sources,as appear in the tables to follow.Shannon's work did not come to my attention until after this paper was prepared,so that the two papers can be considered as separate tests of comparable hy- potheses. This content downloaded from 202.120.14.67 on Sun,19 Feb 2017 15:39:15 UTC All use subject to http://about.jstor.org/terms
SOME SOCIAL REQUISITES OF DEMOCRACY 75 II. ECONOMIC DEVELOPMENT AND DEMOCRACY Perhaps the most widespread generalization linking political systems to other aspects of society has been that democracy is related to the state of eco- nomic development. Concretely, this means that the more well-to-do a nation, the greater the chances that it will sustain democracy. From Aristotle down to the present, men have argued that only in a wealthy society in which relatively few citizens lived in real poverty could a situation exist in which the mass of the population could intelligently participate in politics and could develop the self-restraint necessary to avoid succumbing to the appeals of irresponsible demagogues. A society divided between a large impoverished mass and a small favored elite would result either in oligarchy (dictatorial rule of the small upper stratum) or in tyranny (popularly based dictatorship). And these two political forms can be given modern labels: tyranny's modern face is Communism or Peronism; oligarchy appears today in the form of traditionalist dictatorships such as we find in parts of Latin America, Thailand, Spain or Portugal. As a means of concretely testing this hypothesis, various indices of economic development-wealth, industrialization, urbanization and education-have been defined, and averages (means) have been computed for the countries which have been classified as more or less democratic in the Anglo-Saxon world and Europe and Latin America. In each case, the average wealth, degree of industrialization and urbaniza- tion, and level of education is much higher for the more democratic countries, as the data presented in Table II indicate. If we had combined Latin America and Europe in one table, the differences would have been greater." The main indices of wealth used here are per capita income, number of per- sons per motor vehicle and per physician, and the number of radios, telephones, and newspapers per thousand persons. The differences are striking on every score, as Table II indicates in detail. In the more democratic European coun- tries, there are 17 persons per motor vehicle compared to 143 for the less demo- 11 Lyle WV. Shannon has correlated indices of economic development with whether a country is self-governing or not, and his conclusions are substantially the same. Since Shannon does not give details on the countries categorized as self-governing and non-self- governing, there is no direct measure of the relation between "democratic" and "self- governing" countries. All the countries examined in this paper, however, were chosen on the assumption that a characterization as "democratic" is meaningless for a non-self- governing country, and therefore, presumably, all of them, whether democratic or dicta- torial, would fall within Shannon's "self-governing" category. Shannon shows that under- development is related to lack of self-government; my data indicate that once self-govern- ment is attained, development is still related to the character of the political system. See Shannon (ed.), Underdeveloped Areas (New York: Harper, 1957), and also his article, "Is Level of Government Related to Capacity for Self-Government?" American Journal of Economics and Sociology, Vol. 17 (1958) pp. 367-382. In the latter paper, Shannon con- structs a composite index of development, using some of the same indices, such as inhabi- tants per physician, and derived from the same United Nations sources, as appear in the tables to follow. Shannon's work did not come to my attention until after this paper was prepared, so that the two papers can be considered as separate tests of comparable hy- potheses. This content downloaded from 202.120.14.67 on Sun, 19 Feb 2017 15:39:15 UTC All use subject to http://about.jstor.org/terms
76 THE AMERICAN POLITICAL SCIENCE REVIEW TABLE II.A COMPARISON OF EUROPEAN,ENGLISH-SPEAKING AND LATIN AMERICAN COUNTRIES,DIVIDED INTO TWO GROUPS,"MORE DEMOCRATIC"AND "LESS DEMOCRATIC,"BY INDICES OF WEALTH,INDUSTRIALIZATION, EDUCATION,AND URBANIZATIONI A.Indices of Wealth Per Capita Thousands Persons Telephonea Radios Newapaper Means Income? of Persons Per Motor Per1,000 Per1,000 Copies Per in多 Per Doctor Vehicle 1,000 Persons? European and English-speaking Stable Democracies 695 .86 17 205 350 341 European and English-speaking Unstable Democracies and Dictatorships 308 1.4 143 58 160 167 Latin American Democracies and Unstable Dictatorahipa 171 2.1 99 25 85 102 Latin American Stable Dictator- ships 119 4.4 274 10 43 43 Rangea European Stable Democracies 420-1,453 .7-1.2 3-62 43400 160-995 242-570 European Dictatorships 128-482 .6-4 10-538 7-196 42-307 46-390 Latin American Democracies 112-346 .8-3.3 31-174 12-58 38-148 51-233 Latin American Stable Dictator- ships 40-3311.0-10.8 38-428 1-24 4-154 4-111 B.Indices of Industrialization Percentage of Males Per Capita Energy Means in Agricultures Consumed? European Stable Democracies 21 3.6 European Dictatorships 41 1.4 Latin American Democracies .6 Latin American Stable Dictatorships 67 .25 Ranges European Stable Democracies 6-46 1.4-7.8 European Dictatorships 16-60 ,27-3.2 Latin American Democracies 30-63 .300.9 Latin American Stable Dietatorships 48-87 02-1.27 C.Indices of Education Primary Education Post-Primary Higher Education Means Percentage Enrollment Per Enrollment Per Enrollment Per Literateto 1,000 Persons1 1,000 Persons1 1,000 Personsu European Stable Democracies 96 134 4.2 European Dictatorships 85 121 2 3.5 Latin American Democracies 74 101 13 2.0 Latin American Dictatorahips 8 72 8 1.3 Ranges European Stable Democracies 95-100 96-179 19-83 1.7-17.83 European Dictatorships 55-98 61-165 8-37 1.6-6.1 Latin American Democracies 48-87 75-137 7-27 .7-4.6 Latin American Dictatorahipa 11-76 11-149 324 ,2-3.1 (Continued on facing page) This content downloaded from 202.120.14.67 on Sun,19 Feb 2017 15:39:15 UTC All use subject to http://about.jstor.org/terms
76 THE AMERICAN POLITICAL SCIENCE REVIEW TABLE II. A COMPARISON OF EUROPEAN, ENGLISH-SPEAKING AND LATIN AMERICAN COUNTRIES, DIVIDED INTO TWO GROUPS, "MORE DEMOCRATIC" AND "LESS DEMOCRATIC," BY INDICES OF WEALTH, INDUSTRIALIZATION, EDUCATION, AND URBANIZATION' A. Indices of Wealth Per Capita Thousands Persons Telephones Radios Newspaper Means Income2 of Persons Per Motor Per 1,000 Per 1,000 Copies Per in $ Per Doctor3 Vehicle4 Persons5 Persons6 1,000 Persons7 European and English-speaking Stable Democracies 695 .86 17 205 350 341 European and English-speaking Unstable Democracies and Dictatorships 308 1.4 143 58 160 167 Latin American Democracies and Unstable Dictatorships 171 2.1 99 25 85 102 Latin American Stable Dictator- ships 119 4.4 274 10 43 43 Ranges European Stable Democracies 420-1,453 .7- 1.2 3-62 43-400 160-995 242-570 European Dictatorships 128- 482 .6- 4 10-538 7-196 42-307 46-390 Latin American Democracies 112- 346 .8- 3.3 31-174 12- 58 38-148 51-233 Latin American Stable Dictator- ships 40- 331 1.0-10.8 38-428 1- 24 4-154 4-111 B. Indices of Industrialization Percentage of Males Per Capita Energy Means in Agricultures Consumed9 European Stable Democracies 21 3.6 European Dictatorships 41 1.4 Latin American Democracies 52 .6 Latin American Stable Dictatorships 67 .25 Ranges European Stable Democracies 6-46 1.4 -7.8 European Dictatorships 16-60 .27-3 .2 Latin American Democracies 30-63 .30-0.9 Latin American Stable Dictatorships 46-87 .02-1.27 C. Indices of Education Primary Education Post-Primary Higher Education Means LPteratge' Enrollment Per Enrollment Per Enrollment Per Literate'0 1,000 Persons" 1,000 Persons'2 1,000 Persons13 European Stable Democracies 96 134 44 4.2 European Dictatorships 85 121 22 3.5 Latin American Democracies 74 101 13 2.0 Latin American Dictatorships 46 72 8 1.3 Ranges European Stable Democracies 95-100 96-179 19-83 1.7-17.83 European Dictatorships 55- 98 61-165 8-37 1.6- 6.1 Latin American Democracies 48- 87 75-137 7-27 .7- 4.6 Latin American Dictatorships 11- 76 11-149 3-24 .2- 3.1 (Continued on facing page) This content downloaded from 202.120.14.67 on Sun, 19 Feb 2017 15:39:15 UTC All use subject to http://about.jstor.org/terms
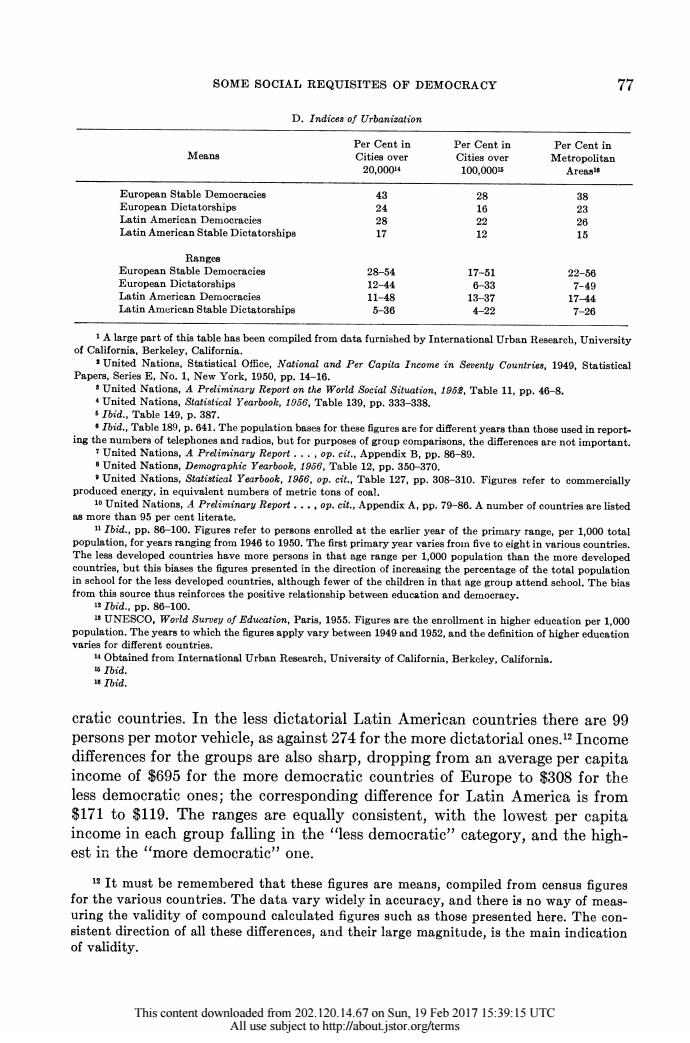
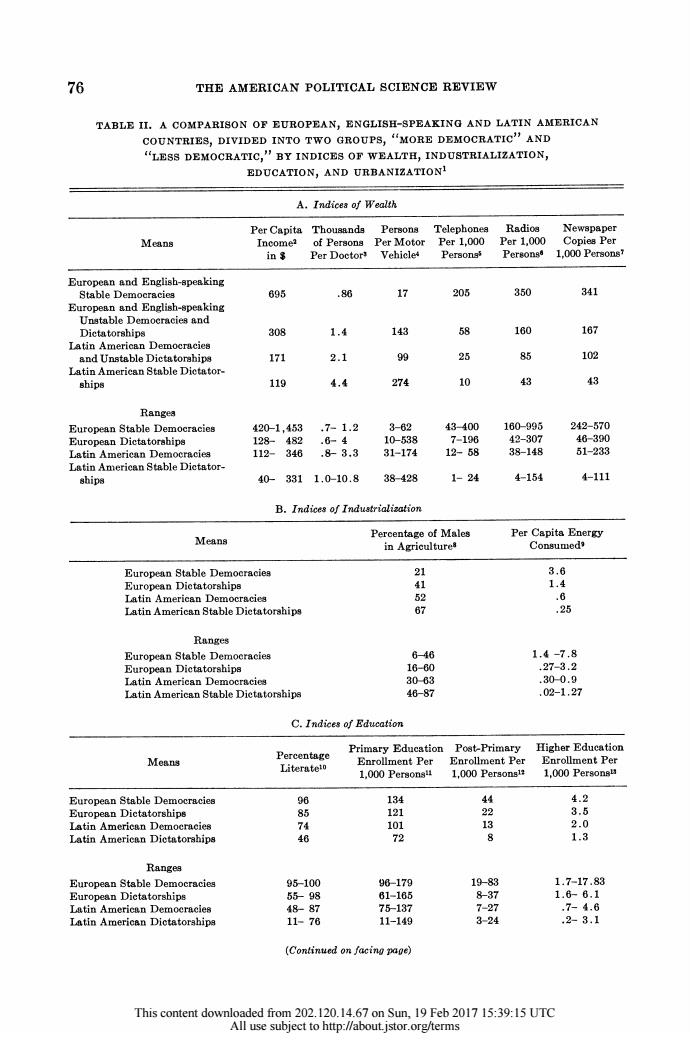
SOME SOCIAL REQUISITES OF DEMOCRACY 77 D.Indices of Urbanization Per Cent in Per Cent in Per Cent in Means Cities over Cities over Metropolitan 20,00014 100.0005 Areasie European Stable Democracies 43 28 38 European Dietatorships 24 16 23 Latin American Democracies 28 22 2 Latin American Stable Dietatorships 17 12 15 Ranges European Stable Democracies 28-54 17-51 22-56 European Dictatorships 12-44 6-33 7-49 Latin American Democracies 11-48 13-37 17-44 Latin American Stable Dictatorships 5-36 4-22 7-26 1A large part of this table has been compiled from data furnished by International Urban Research,University of California,Berkeley,California. 1United Nations,Statistical Office,National and Per Capita Income in Seventy Countries,1949,Statistical Papera,Series E,No.1,New York,1950,pp.14-16. United Nations,A Prdiminary Report on the World Social Situation,1958,Table 11,pp.46-8. United Nations,Statistical Yearbook,1956,Table 139,pp.333-338. s Ibid.,Table 149,p.387. Tbid.,Table 189,p.641.The population bases for these figures are for different years than those used in report- ing the numbers of telephones and radios,but for purposes of group comparisons,the differences are not important. United Nations,A Preliminary Report....op.cit.,Appendix B,pp.86-89. United Nations,Demographic Yearbook,1956,Table 12,pp.350-370. United Nations,Statistical Yearbook,1966.op.cit..Table 127,pp.308-310.Figures refer to commercially produced energy,in equivalent numbers of metrie tons of coal. 10 United Nations,A Prdliminary Report...,op.cit.,Appendix A,pp.79-86.A number of countries are listed as more than 95 per cent literate. Tbid.,pp.86-100.Figures refer to persons enrolled at the earlier year of the primary range,per 1,000 total population,for years ranging from 1946 to 1950.The first primary year varies froin five to eight in various countries. The less developed countries have more persons in that age range per 1,000 population than the more developed countries,but this biases the figures presented in the direction of increasing the percentage of the total population in school for the less developed countries,although fewer of the children in that age group attend achool.The bias from this source thus reinforces the positive relationship between education and democraey. Ibid,pp.86-100. UNESCO,World Survey of Edueation,Paris,1955.Figures are the enrollment in higher education per 1,000 population.The years to which the figures apply vary between 1949 and 1952.and the definition of higher edueation varies for different countries. Obtained from International Urban Research,Univeraity of California,Berkeley,California. s Ibid. i Ibid. cratic countries.In the less dictatorial Latin American countries there are 99 persons per motor vehicle,as against 274 for the more dictatorial ones.12 Income differences for the groups are also sharp,dropping from an average per capita income of $695 for the more democratic countries of Europe to $308 for the less democratic ones;the corresponding difference for Latin America is from $171 to $119.The ranges are equally consistent,with the lowest per capita income in each group falling in the"less democratic"category,and the high- est in the“more democratic?”one. 1 It must be remembered that these figures are means,compiled from census figures for the various countries.The data vary widely in accuracy,and there is no way of meas- uring the validity of compound calculated figures such as those presented here.The con- sistent direction of all these differences,and their large magnitude,is the main indication of validity. This content downloaded from 202.120.14.67 on Sun,19 Feb 2017 15:39:15 UTC All use subject to http://about.Istor.org/terms
SOME SOCIAL REQUISITES OF DEMOCRACY 77 D. Indices of Urbanization Per Cent in Per Cent in Per Cent in Means Cities over Cities over Metropolitan 20,00014 100,000'5 Areas16 European Stable Democracies 43 28 38 European Dictatorships 24 16 23 Latin American Democracies 28 22 26 Latin American Stable Dictatorships 17 12 15 Ranges European Stable Democracies 28-54 17-51 22-56 European Dictatorships 12-44 6-33 7-49 Latin American Democracies 11-48 13-37 17-44 Latin American Stable Dictatorships 5-36 4-22 7-26 1 A large part of this table has been compiled from data furnished by International Urban Research, University of California, Berkeley, California. 2 United Nations, Statistical Office, National and Per Capita Income in Seventy Countries, 1949, Statistical Papers, Series E, No. 1, New York, 1950, pp. 14-16. 8 United Nations, A Preliminary Report on the World Social Situation, 1952, Table 11, pp. 46-8. 4 United Nations, Statistical Yearbook, 1956, Table 139, pp. 333-338. 6 Ibid., Table 149, p. 387. 6 Ibid., Table 189, p. 641. The population bases for these figures are for different years than those used in report- ing the numbers of telephones and radios, but for purposes of group comparisons, the differences are not important. 7 United Nations, A Preliminary Report .. ., op. cit., Appendix B, pp. 86-89. 8 United Nations, Demographic Yearbook, 1956, Table 12, pp. 350-370. 9 United Nations, Statistical Yearbook, 1956, op. cit., Table 127, pp. 308-310. Figures refer to commercially produced energy, in equivalent numbers of metric tons of coal. 10 United Nations, A Preliminary Report... , op. cit., Appendix A, pp. 79-86. A number of countries are listed as more than 95 per cent literate. 11 Ibid., pp. 86-100. Figures refer to persons enrolled at the earlier year of the primary range, per 1,000 total population, for years ranging from 1946 to 1950. The first primary year varies from five to eight in various countries. The less developed countries have more persons in that age range per 1,000 population than the more developed countries, but this biases the figures presented in the direction of increasing the percentage of the total population in school for the less developed countries, although fewer of the children in that age group attend school. The bias from this source thus reinforces the positive relationship between education and democracy. 12 Ibid., pp. 86-100. Is UNESCO, World Survey of Education, Paris, 1955. Figures are the enrollment in higher education per 1,000 population. The years to which the figures apply vary between 1949 and 1952, and the definition of higher education varies for different countries. 14 Obtained from International Urban Research, University of California, Berkeley, California. 1 Ibid. 16 Ibid. cratic countries. In the less dictatorial Latin American countries there are 99 persons per motor vehicle, as against 274 for the more dictatorial ones.'2 Income differences for the groups are also sharp, dropping from an average per capita income of $695 for the more democratic countries of Europe to $308 for the less democratic ones; the corresponding difference for Latin America is from $171 to $119. The ranges are equally consistent, with the lowest per capita income in each group falling in the "less democratic" category, and the high- est in the "more democratic" one. 12 It must be remembered that these figures are means, compiled from census figures for the various countries. The data vary widely in accuracy, and there is no way of meas- uring the validity of compound calculated figures such as those presented here. The con- sistent direction of all these differences, and their large magnitude, is the main indication of validity. This content downloaded from 202.120.14.67 on Sun, 19 Feb 2017 15:39:15 UTC All use subject to http://about.jstor.org/terms

78 THE AMERICAN POLITICAL SCIENCE REVIEW Industrialization-indices of wealth are clearly related to this,of course- is measured by the percentage of employed males in agriculture,and the per capita commercially produced "energy"being used in the country,measured in terms of tons of coal per person per year.Both of these indices show equally consistent results.The average percentage of employed males working in agri- culture and related occupations was 21 in the "more democratic"European countries,and 41 in the "less democratic,"52 in the "less dictatorial"Latin American countries,and 67 in the "more dictatorial."The differences in per capita energy employed in the country are equally large. The degree of urbanization is also related to the existence of democracy.is Three different indices of urbanization are available from data compiled by International Urban Research (Berkeley,California),the percentage of the population in places of 20,000 and over,the percentage in communities of 100,000 and over,and also the percentage residing in standard metropolitan areas.On all three of these indices of urbanization,the more democratic coun- tries score higher than the less democratic,for both of the political culture areas under investigation. Many have suggested that the better educated the population of a country, the better the chances for democracy,and the comparative data available sup- port this proposition.The "more democratic"countries of Europe are almost entirely literate:the lowest has a rate of 96 per cent,while the "less democratic" nations have an average literacy rate of 85 per cent.In Latin America,the dif- ference is between an average rate of 74 per cent for the "less dictatorial" countries and 46 per cent for the "more dictatorial."14 The educational enroll- is Urbanization has often been linked to democracy by political theorists.Harold J. Laski asserted that "organized democracy is the product of urban life,"and that it was natural therefore that it should have "made its first effective appearance"in the Greek city states,limited as was their definition of "citizen."See his article"Democracy"in the Encyclopedia of the Social Sciences (New York:Macmillan,1937),Vol.V,pp.76-85.Max Weber held that the city,as a certain type of political community,is a peculiarly Western phenomenon,and traced the emergence of the notion of"citizenship"'from social develop- ments closely related to urbanization.For a partial statement of his point of view,see the chapter on "Citizenship,"in General Economic History (Glencoe:The Free Press,1950), pp.315-338.It is significant to note that before 1933 the Nazi electoral strength was great- est in small communities and rural areas.Berlin,the only German city of over two million, never gave the Nazis over 25 per cent of the vote in a free election.The modal Nazi,like the modal French Poujadist or Italian neo-Fascist today,was a self-employed resident of a small town or rural district.Though the communists,as a workers'party,are strongest in the working-class neighborhoods of large cities within countries,they have great elec- toral strength only in the less urbanized European nations,e.g.,Greece,Finland,France, Italy. The pattern indicated by a comparison of the averages for each group of countries is sustained by the ranges (the high and low extremes)for each index.Most of the ranges overlap,that is,some countries which are in the low category with regard to politics are higher on any given index than some which are high on the scale of democracy.It is note- worthy that in both Europe and Latin America,the nations which are lowest on any of the indices presented in the table are also in the"less democratic"category.Conversely,al- most all countries which rank at the top of any of the indices are in the "more demo- cratic”class. This content downloaded from 202.120.14.67 on Sun,19 Feb 2017 15:39:15 UTC All use subject to http://about.jstor.org/terms
78 THE AMERICAN POLITICAL SCIENCE REVIEW Industrialization-indices of wealth are clearly related to this, of course- is measured by the percentage of employed males in agriculture, and the per capita commercially produced "energy" being used in the country, measured in terms of tons of coal per person per year. Both of these indices show equally consistent results. The average percentage of employed males working in agri- culture and related occupations was 21 in the "more democratic" European countries, and 41 in the "less democratic," 52 in the "less dictatorial" Latin American countries, and 67 in the "more dictatorial." The differences in per capita energy employed in the country are equally large. The degree of urbanization is also related to the existence of democracy.'3 Three different indices of urbanization are available from data compiled by International Urban Research (Berkeley, California), the percentage of the population in places of 20,000 and over, the percentage in communities of 100,000 and over, and also the percentage residing in standard metropolitan areas. On all three of these indices of urbanization, the more democratic coun- tries score higher than the less democratic, for both of the political culture areas under investigation. Many have suggested that the better educated the population of a country, the better the chances for democracy, and the comparative data available sup- port this proposition. The "more democratic" countries of Europe are almost entirely literate: the lowest has a rate of 96 per cent, while the "less democratic" nations have an average literacy rate of 85 per cent. In Latin America, the dif- ference is between an average rate of 74 per cent for the "less dictatorial" countries and 46 per cent for the "more dictatorial."'14 The educational enroll- 1' Urbanization has often been linked to democracy by political theorists. Harold J. Laski asserted that "organized democracy is the product of urban life," and that it was natural therefore that it should have "made its first effective appearance" in the Greek city states, limited as was their definition of "citizen." See his article "Democracy" in the Encyclopedia of the Social Sciences (New York: Macmillan, 1937), Vol. V, pp. 76-85. Max Weber held that the city, as a certain type of political community, is a peculiarly Western phenomenon, and traced the emergence of the notion of "citizenship" from social develop- ments closely related to urbanization. For a partial statement of his point of view, see the chapter on "Citizenship," in General Economic History (Glencoe: The Free Press, 1950), pp. 315-338. It is significant to note that before 1933 the Nazi electoral strength was great- est in small communities and rural areas. Berlin, the only German city of over two million, never gave the Nazis over 25 per cent of the vote in a free election. The modal Nazi, like the modal French Poujadist or Italian neo-Fascist today, was a self-employed resident of a small town or rural district. Though the communists, as a workers' party, are strongest in the working-class neighborhoods of large cities within countries, they have great elec- toral strength only in the less urbanized European nations, e.g., Greece, Finland, France, Italy. 14 The pattern indicated by a comparison of the averages for each group of countries is sustained by the ranges (the high and low extremes) for each index. Most of the ranges overlap, that is, some countries which are in the low category with regard to politics are higher on any given index than some which are high on the scale of democracy. It is note- worthy that in both Europe and Latin America, the nations which are lowest on any of the indices presented in the table are also in the "less democratic" category. Conversely, al- most all countries which rank at the top of any of the indices are in the "more demo- cratic" class. This content downloaded from 202.120.14.67 on Sun, 19 Feb 2017 15:39:15 UTC All use subject to http://about.jstor.org/terms