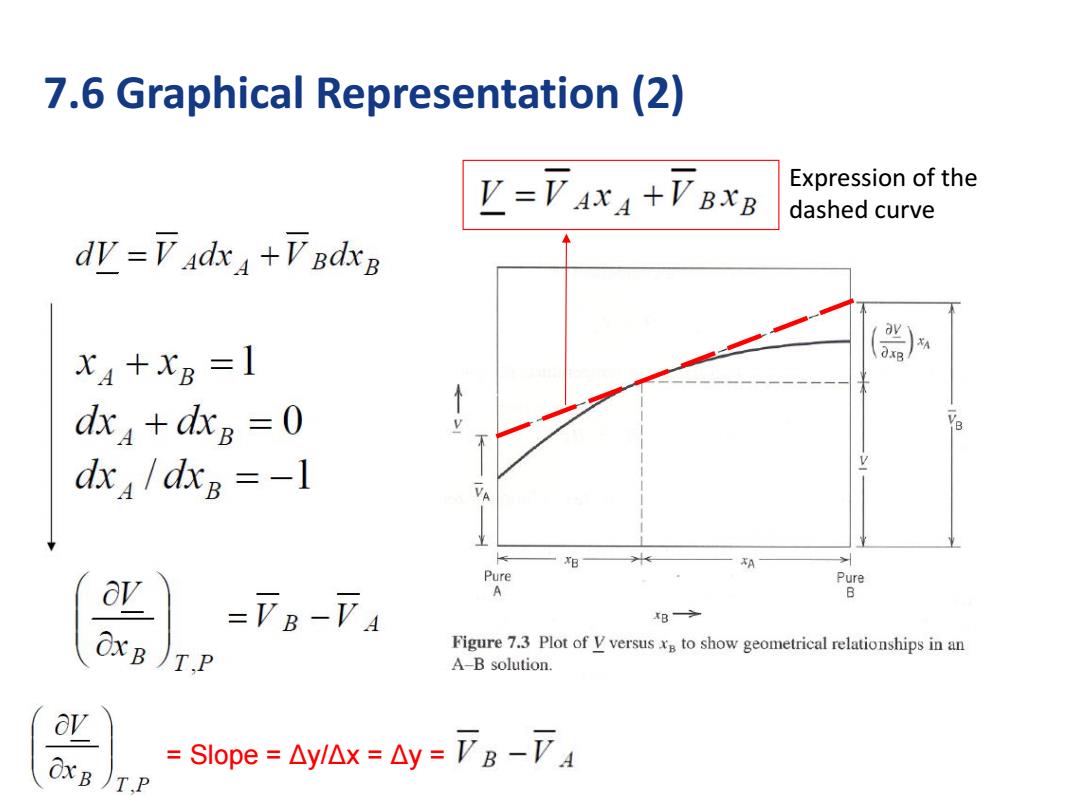
7.6 Graphical Representation (2) L=VAXA+VBXB Expression of the dashed curve dv=V adxa+VBdxB xA+X8=1 dx +dxB =0 dxa/dxB =-1 VA B A Pure ur A B→ OxB)T.P Figure 7.3 Plot of V versus xB to show geometrical relationships in an A-B solution. OxB )T.P =Slope=△ylAx=△y=TB-F4
7.6 Graphical Representation (2) = Slope = Δy/Δx = Δy = Expression of the dashed curve

7.7 Nonideal solutions (1) Ginital-XAGA+XgGg GM=RT∑n Ex=∑G=∑m,, Ideal solution Slope=-∞ G T Non-ideal solution:practical solution T2 A 阳→ B Many forms (d) Figure 7.4 Molar properties for an ideal solu- tion A-B:(a)volume of mixing,(b)enthalpy of mixing.(c)entropy of mixing,and (d) Gibbs free energy of mixing. Gfinal-XAGA+XgGB 3/12/2022 Chapt 9:Solution 7
7.7 Nonideal solutions (1) Ginital=xAGA+xBGB } 3/12/2022 Chapt 9: Solution 7
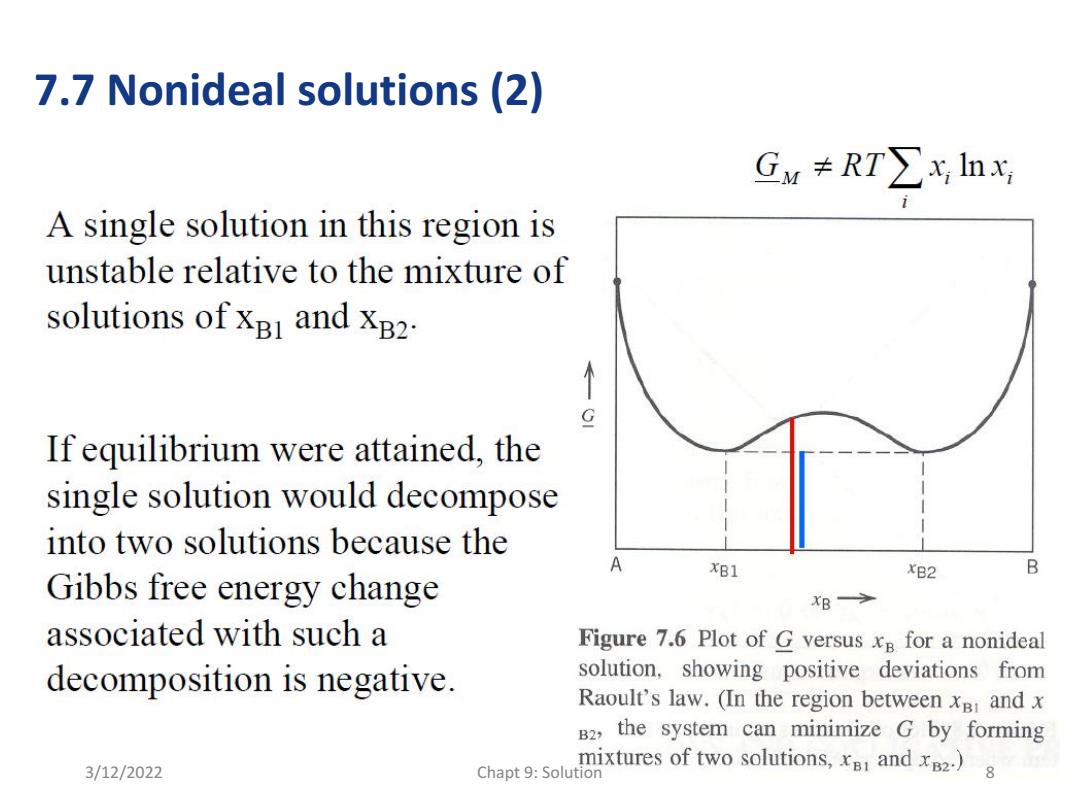
7.7 Nonideal solutions(2) GM≠RT∑xhx, A single solution in this region is unstable relative to the mixture of solutions of xBI and XB2. 个 If equilibrium were attained,the single solution would decompose into two solutions because the A XB1 xB2 B Gibbs free energy change XB今 associated with such a Figure 7.6 Plot of G versus xB for a nonideal decomposition is negative. solution,showing positive deviations from Raoult's law.(In the region between xB and x B2,the system can minimize G by forming 3/12/2022 Chapt 9:Solution mixtures of two solutions,x8 and xB2.) 8
7.7 Nonideal solutions (2) 3/12/2022 Chapt 9: Solution 8
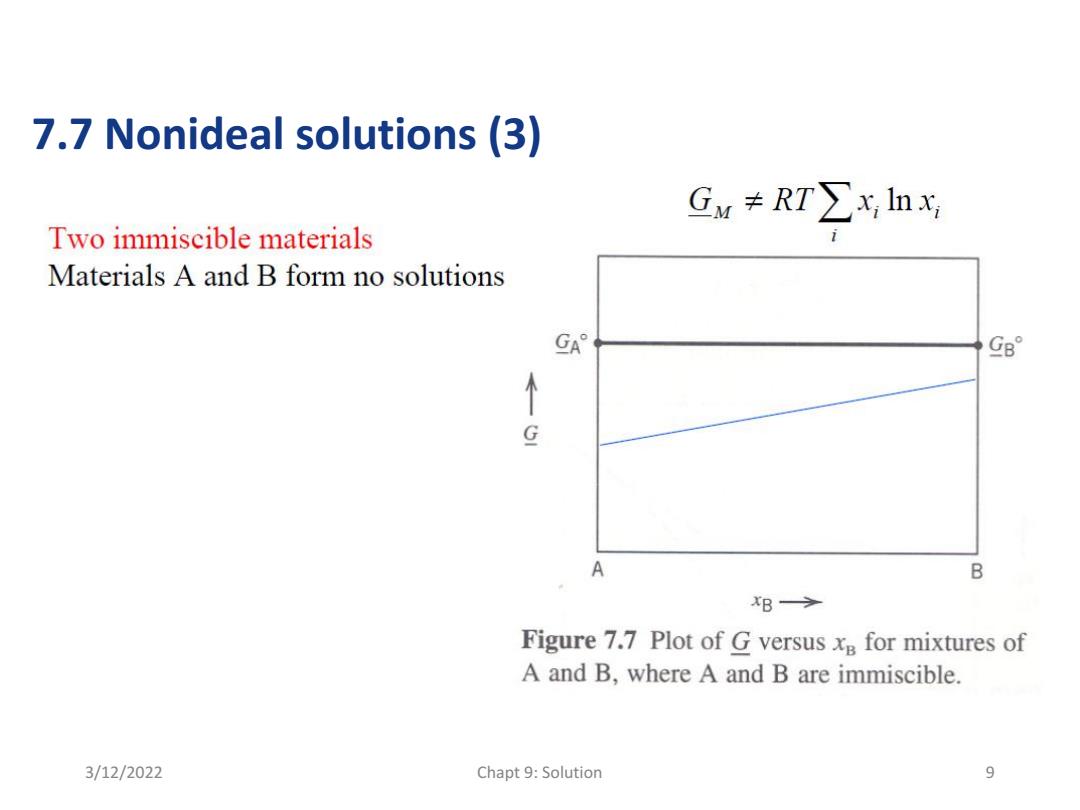
7.7 Nonideal solutions (3) GM≠RT∑xlnx Two immiscible materials Materials A and B form no solutions GA° G8° 个 A B XB-> Figure 7.7 Plot of G versus xB for mixtures of A and B,where A and B are immiscible. 3/12/2022 Chapt 9:Solution 9
7.7 Nonideal solutions (3) 3/12/2022 Chapt 9: Solution 9
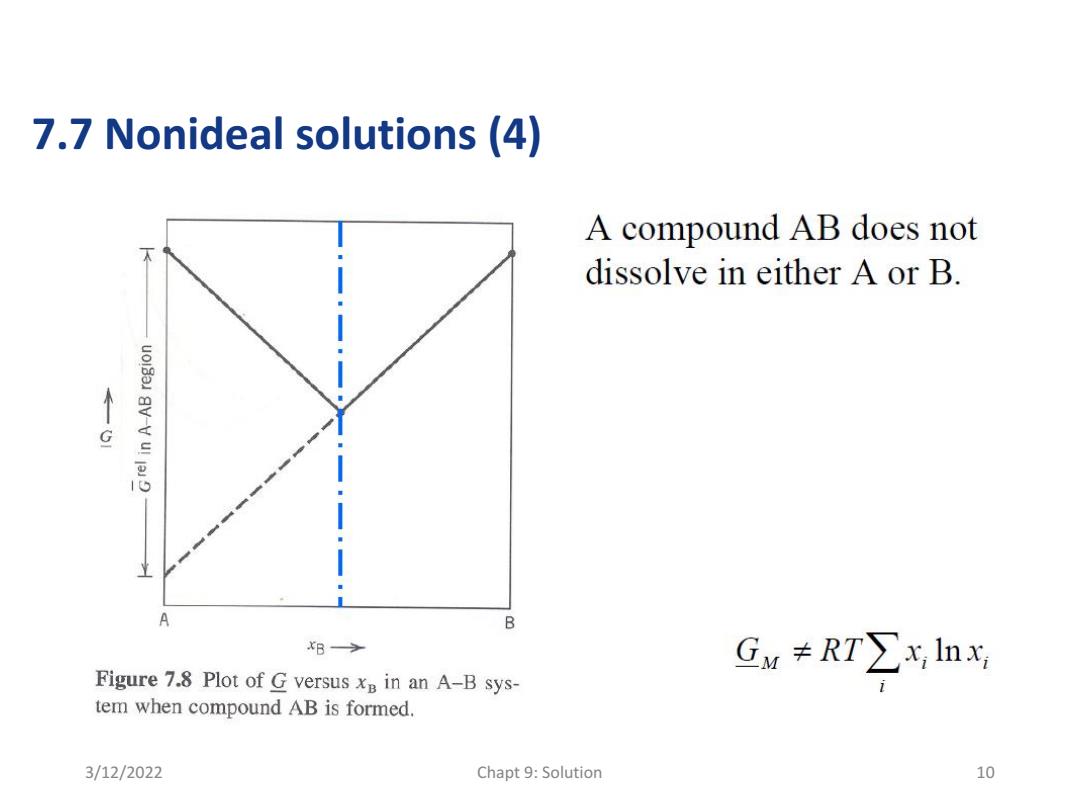
7.7 Nonideal solutions (4) A compound AB does not dissolve in either A or B. B xB-> Figure 7.8 Plot of G versus xp in an A-B sys- Gw≠RT∑,lh tem when compound AB is formed. 3/12/2022 Chapt 9:Solution 10
7.7 Nonideal solutions (4) 3/12/2022 Chapt 9: Solution 10