20 第二节MATLABI图形处理 款学建模
第二节 MATLAB图形处理
一.二维图形显示 1.基本二维图形绘制语句 p1ot(x1,Y1,选项1,x2,Y2,选项2,,·.) 线型选项 标记符号选项 -1 实线 颜色选项 -- 虚线 红 点虚线 g' 绿 点划线 > 6' 蓝 m 红紫 none'无线 黄 蓝绿 diamond k 黑 [g,b] square! 24位真彩 'pentagram' 数学建模 hexagram
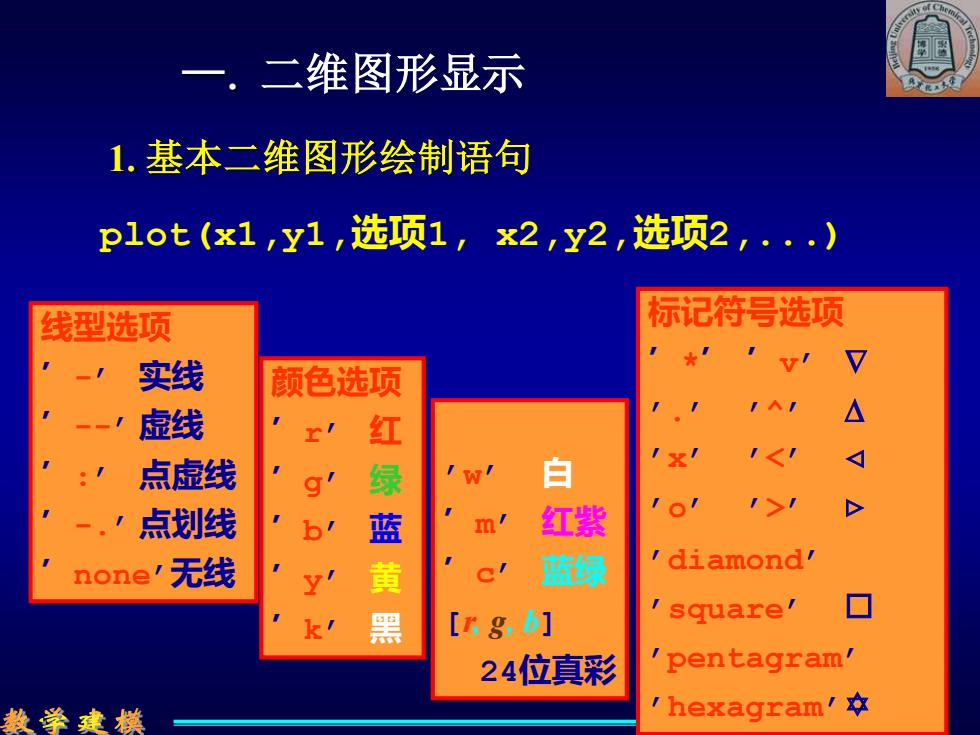
一. 二维图形显示 plot(x1,y1,选项1, x2,y2,选项2,...) 线型选项 ’-’ 实线 ’--’ 虚线 ’ :’ 点虚线 ’-.’ 点划线 ’ none’无线 颜色选项 ’ r’ 红 ’ g’ 绿 ’b’ 蓝 ’ y’ 黄 ’k’ 黑 ’w’ 白 ’ m’ 红紫 ’ c’ 蓝绿 [r, g, b] 24位真彩 标记符号选项 ’*’ ’ v’ ’.’ ’^’ ’x’ ’<’ ’o’ ’>’ ’diamond’ ’square’ ’pentagram’ ’hexagram’ 1. 基本二维图形绘制语句

2.二维曲线的标注 axisaxis (min,Xmax,Jmin,max ] gridgrid on off title:tit1e('标题) x1abe1:x1abel('x轴标题) y1 label:y1abel('J轴标题′) 款学建模
axis: grid: title: xlabel: ylabel: axis([ xmin , xmax , ymin , ymax ]) grid on|off title(’标题’) xlabel(’x轴标题’) ylabel(’y轴标题’) 2. 二维曲线的标注
3.绘图模式下鼠标的应用 ginput:[x,y,button]ginput (n) line:line (x,y) text text (x,y,s) text (x,y,s,'s') gtext:gtext(s) 数学建模 00
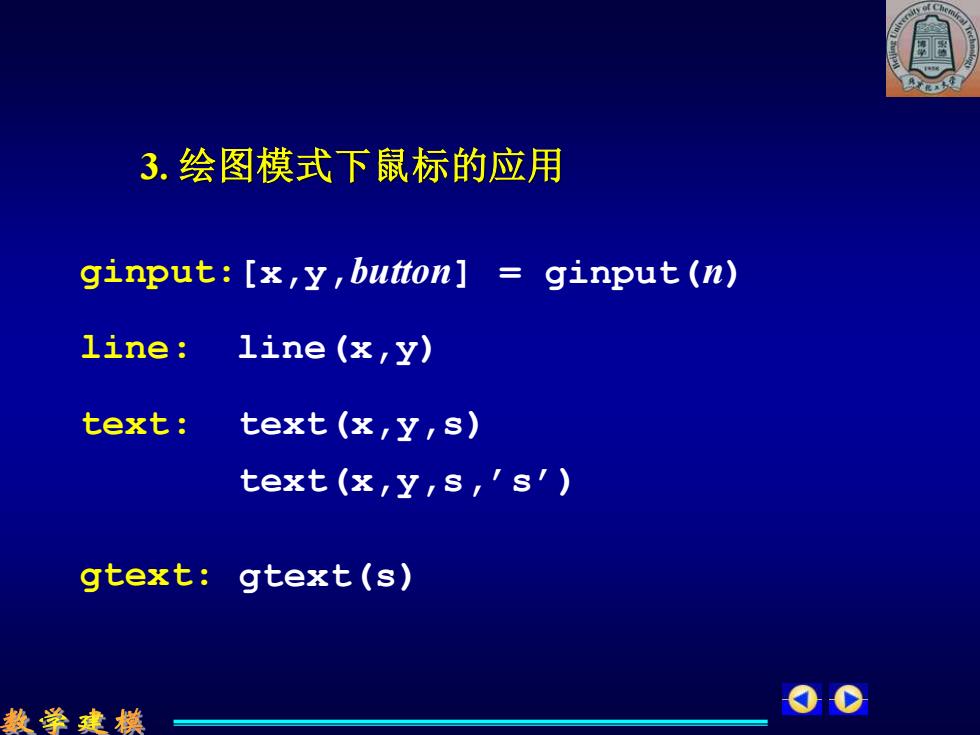
ginput: line: text: gtext: [x,y,button] = ginput(n) line(x,y) text(x,y,s) text(x,y,s,’s’) gtext(s) 3. 绘图模式下鼠标的应用
4.图形窗口的分割:subplot subplot n,m,k subplot (2,2,1),fplot ('humps',[0 1]) subplot (2,2,2),fplot (abs (exp ( *x*(0:9))*ones(10,1))',[02*pi]) subplot (2,2,3),fplot ([tan (x),sin (x), cos(x)]',2*pi*[-11-11]) sbp1ot(2,2,4),fp1ot('sin(1./x)',[0.0 10.1],1e-3) 数学建模 00
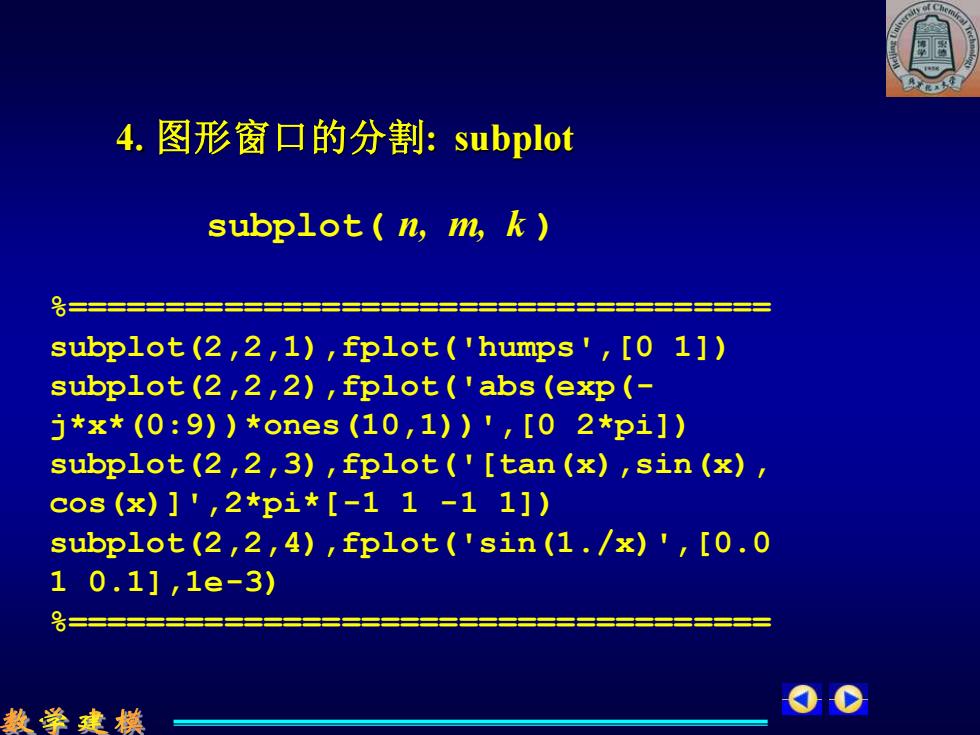
4. 图形窗口的分割: subplot subplot( n, m, k ) %==================================== subplot(2,2,1),fplot('humps',[0 1]) subplot(2,2,2),fplot('abs(exp(- j*x*(0:9))*ones(10,1))',[0 2*pi]) subplot(2,2,3),fplot('[tan(x),sin(x), cos(x)]',2*pi*[-1 1 -1 1]) subplot(2,2,4),fplot('sin(1./x)',[0.0 1 0.1],1e-3) %====================================