Chapter 7 Vibration monitoring 7.1 Introduction The use of vibration data from rotating machinery to determine machine health has a long history. Traditionally the shop foreman would press the end of a screwdriver against a bearing housing and the handle against his ear, and in this way conduct the pure vibration signal from the bearing to be analysed in his brain. This proved so reliable over many decades that it was attempted to develop instruments which performed the same function but whose performance was reproducible and could function independently of the individual operator's skill and experience (Angelo, 1987). Initially vibration meters, reading an overall rms level of velocity, were introduced. Later on integration of accelerometer signals was introduced. This enabled rms estimates of acceleration, velocity and displacement to take place. The use of peak value and crest factor were also introduced. These estimates proved valuable but experienced operators could still identify incipient faults long before they were detected by these basic vibration meters(Angelo, 1987). The development of the FFT algorithm and affordable, portable, robust battery- powered FFT analysers, allowed the use of much more of the information embedded in the vibration signal and obtaining far more advanced and useful analyses. Today condition-based vibration monitoring has established itself as a reliable and cost effective technique for monitoring and diagnosing machinery faults before leading to irreversible damage, deterioration or unsafe catastrophic breakdowns. It renders signifi- cant benefits, including decreased maintenance costs, increased availability of machinery, reduced spare part stock holdings and improved safety. Condition monitoring involves the continuous or periodic assessment of the condition of a plant or a machine component while it is running, or of a structural component while in service. The maintenance interval is determined by the condition of a machine. This is quite different to a scheduled maintenance programme where a machine is serviced at a specific period in time irrespective of its condition, and a breakdown maintenance programme where a machine is run until it fails. Noise and vibration analysis is one of several condition monitoring techniques (albeit certainly the most widely applied). Other techniques include temperature monitoring, current and voltage monitoring, metallurgical failure analysis, and wear debris analysis. 1
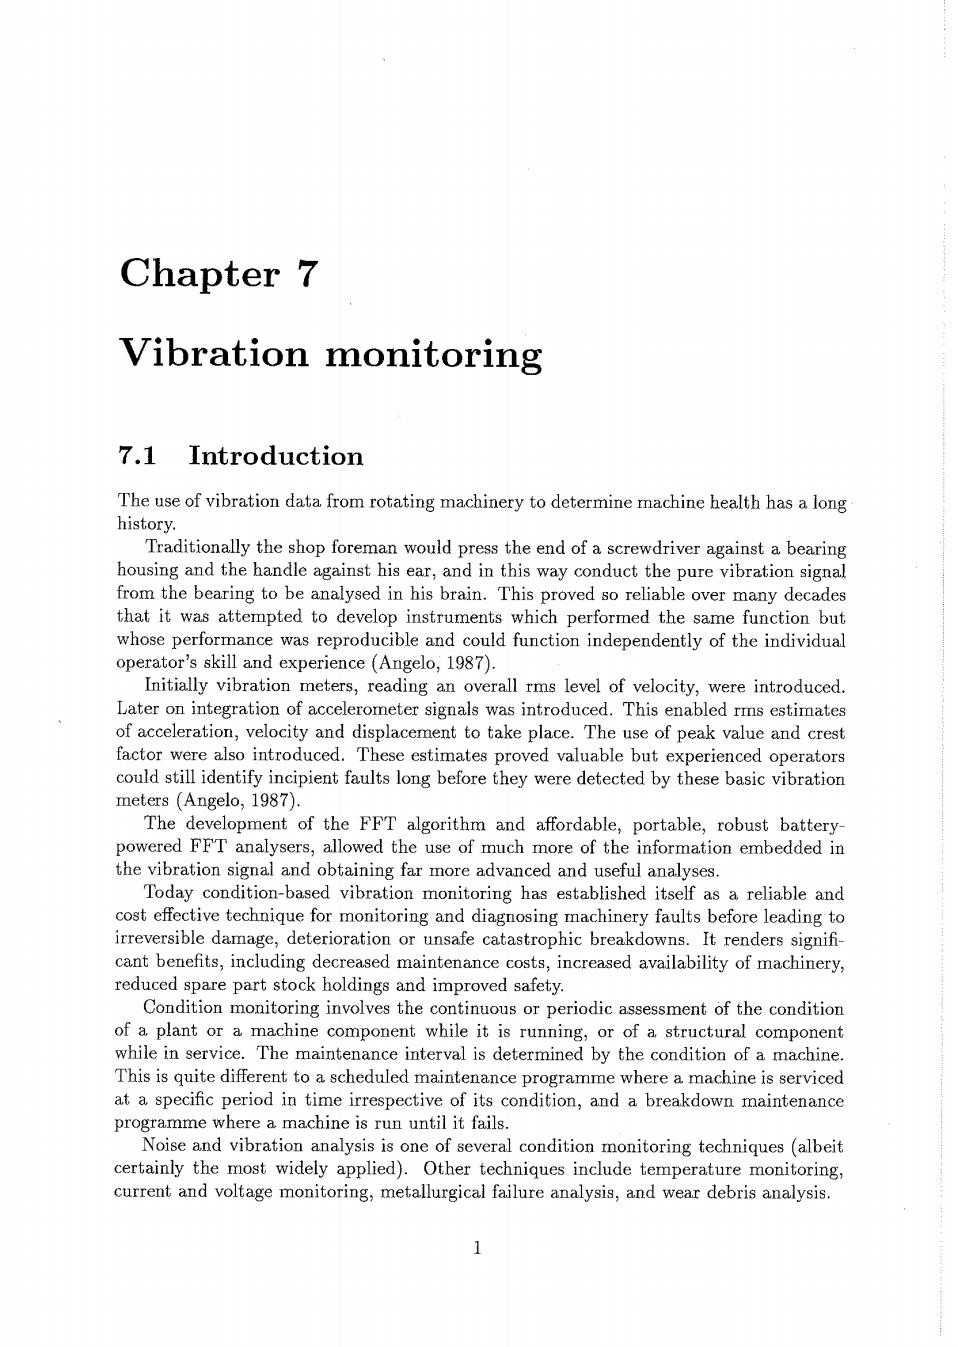
2 CHAPTER 7.VIBRATION MONITORING This chapter is concerned with the usage of vibration as a diagnostic tool.Typical signal analysis techniques are reviewed.Procedures for source identification and fault detection from a variety of different vibration signals are developed. When machines are in a good condition,vibration frequency spectra have characteristic shapes.As faults begin to develop,the frequency spectra change.This is the fundamental basis for using vibration measurements and analysis in condition monitoring.Of course, sometimes the signal which is to be monitored is submerged within some other signal and it cannot be detected by a straightforward time history or spectral analysis.When this is the case,specialised signal processing techniques have to be utilised. 7.2 Vibration as a diagnostic tool Single overall(broadband)vibration measurements are useful for evaluating a machine's general condition.However,a detailed frequency analysis is generally necessary for di- agnostic purposes.Various frequency components in the vibration (or noise)frequency spectrum can often be related to certain rotational or reciprocating motions such as shaft rotational speeds,gear tooth meshing frequencies,bearing rotational frequencies,piston reciprocating motions,etc.These signals change in amplitude and/or frequency as a result of wear,eccentricity,unbalanced masses,etc.and can be readily monitored. As a general rule,machines do not break down without some form of warning-pending machine troubles are characterised by an increase in noise and/or vibration levels,and this is used as an indicator.The well known bathtub curve,illustrated in figure 7.1,is a plot of vibration versus time for a machine.The level decreases during the running- in period,increases very slowly during the normal operational duration as normal wear occurs,and finally increases very rapidly as it approaches a possible breakdown.If normal preventative maintenance repairs were performed,repairs would be carried out at specified fixed intervals irrespective of whether or not they were required.By delaying the repair until the monitored noise or vibration levels indicate a significant increase,unnecessary maintenance and 'strip-down'can be avoided.Not only does this minimise delays in production,but unnecessary errors during 'strip-down'which could produce further faults are avoided. Breakdown Repair performed Check intervals increased、 New machine Repair necessary Running-in check interval main enance Time Figure 7.1 The bathtub curve (from Norton,1989)

3 This technique of continuous 'on-condition'monitoring has three primary advantages. Firstly,it avoids catastrophic failures by shutting down a machine when noise or vibration levels reach a pre-determined level.Secondly,there are significant economic advantages as a result of increasing the running time between shut-downs.Thirdly,since the frequency spectrum of a machine in the normal running condition can be used as a reference signal for the machine,subsequent signals when compared with this signal allow for an identification of the source of the fault. The third advantage mentioned above is most important and needs some amplification. Although overall vibration measurements provide a good starting point for fault detection, frequency analysis provides much more information.In addition to diagnosing the fault, it gives an earlier indication of the development of the fault than an overall vibration measurement does.This is illustrated in figure 7.2 where early fault detection via the spectrum analysis results in an early warning. 1)Early fault detection early warning Log A Log f 2)Trend Analysis -determination of date of break down Log A Log A 2 vna ng on spectrum component 504t5 Figure 7.2 Trending frequency components (from Angelo,1987) The choice of a suitable location for the measurement transducer is also important As an illustrative example,consider the bearing housing in figure 7.3.The acceleration measurements are used to monitor the running condition of the shaft and bearing since wear usually occurs at the connection between rotating parts and the stationary support frame,i.e.at the bearings.The accelerometers must be placed such as to obtain as direct a path for vibration as is possible.If this is not the case then the measured signal will be contaminated'by the frequency response characteristics of the part and will not be a true representation of the source signal.Accelerometers A and C are positioned in a more direct path than B or D.Accelerometer C senses the vibration from the bearing more than vibration from other parts of the machine.Accelerometer D would receive a confusion of signals from the bearing and other machine parts.Likewise,accelerometer A is positioned
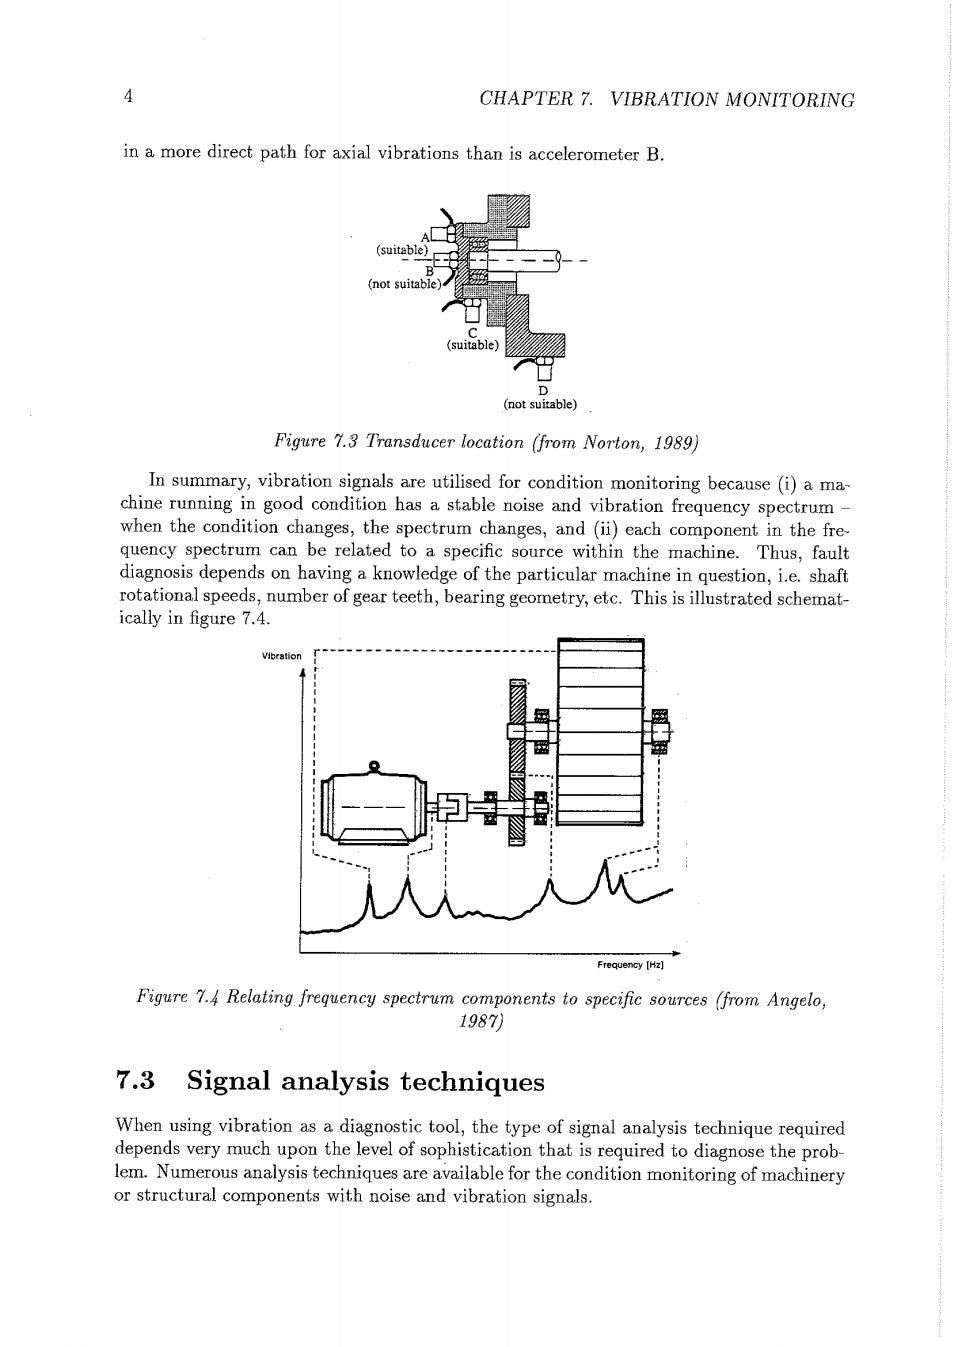
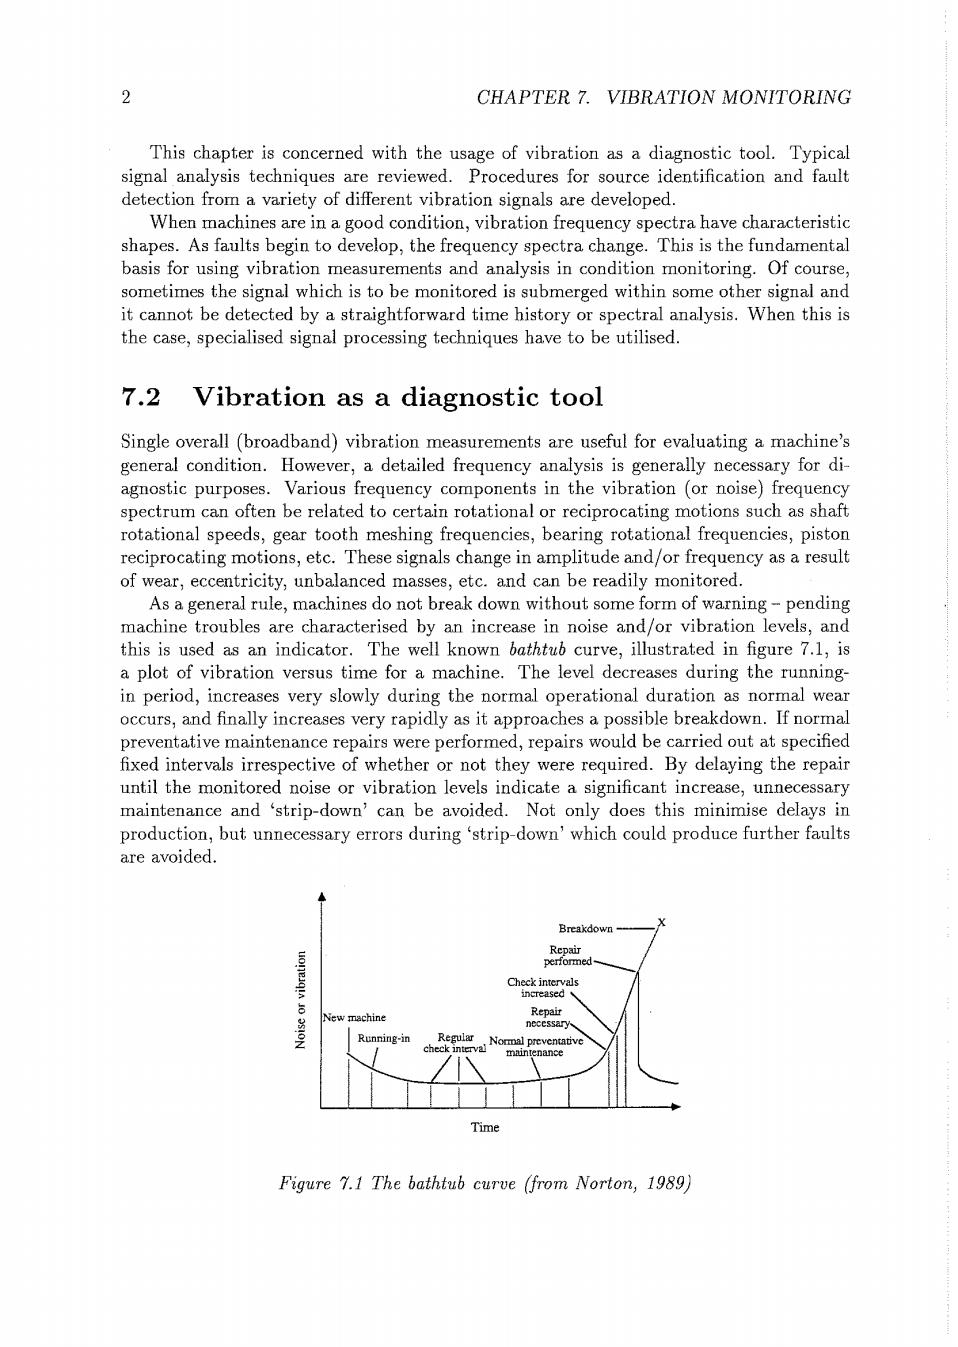
4 CHAPTER 7.VIBRATION MONITORING in a more direct path for axial vibrations than is accelerometer B. (suitable) B (not suitable (suitable) 0 (not suitable) Figure 7.3 Transducer location (from Norton,1989) In summary,vibration signals are utilised for condition monitoring because (i)a ma- chine running in good condition has a stable noise and vibration frequency spectrum- when the condition changes,the spectrum changes,and (ii)each component in the fre- quency spectrum can be related to a specific source within the machine.Thus,fault diagnosis depends on having a knowledge of the particular machine in question,i.e.shaft rotational speeds,number of gear teeth,bearing geometry,etc.This is illustrated schemat- ically in figure 7.4. Vibration Frequency [Hz] Figure 7.4 Relating frequency spectrum components to specific sources (from Angelo, 1987) 7.3 Signal analysis techniques When using vibration as a diagnostic tool,the type of signal analysis technique required depends very much upon the level of sophistication that is required to diagnose the prob- lem.Numerous analysis techniques are available for the condition monitoring of machinery or structural components with noise and vibration signals
5 Available signal analysis techniques are now reviewed with particular emphasis being placed upon their usage as a diagnostic tool.In condition monitoring,it is common to group magnitude and time domain analysis procedures together.This is essentially be- cause the magnitude parameters (rms values,peak values,skewness,etc.)are generally trended over an extended period of time.Thus,magnitude and time domain analysis techniques,are grouped together here.In addition to conventional time and frequency domain analysis techniques,advanced techniques like cepstrum analysis,sound intensity techniques for sound source location,envelope spectrum analysis,recovery of source sig- nals,and propagation path identification are reviewed in this section. 7.3.1 Time domain analysis techniques The analysis of individual time histories of vibration signals is in itself a very useful diagnostic procedure.Quite often,a significant amount of information can be extracted from a simple time history.For a start,the nature of the signal can be clearly identified -i.e.is it transient (impulsive),random or periodic.Furthermore,peak levels can be detected.Also,as vibration levels start to increase due to a deterioration of the condition of the equipment being monitored,the time history changes. Sometimes,when the dominant excitation source is a discrete frequency,it is necessary to phase-average a noise and/or vibration history.This is achieved by synchronising the signal to be measured with the excitation signal,i.e.the measurement is triggered at a specific point (usually a zero crossing)in the excitation cycle.This allows for the removal of unwanted random and periodic signal components.Signals which are synchronous with the trigger will average to their mean value while noise or non-synchronous signals will average to zero.Phase-averaging in the time domain is sometimes referred to as synchronous time-averaging. Several magnitude parameters can be extracted from the time history of a noise or vibration signal: Peak values Sometimes only an overall magnitude is required.This is especially true where it is only necessary to distinguish between acceptable and unsatisfactory states.Peak values of vibration are sometimes used for this purpose.These values are considered quite useful as long as essentially harmonic motion is considered (Broch,1980,p.21) The peak value vibration is the maximum value Xmaz of vibration during a given interval T.It is usually taken as the maximum deviation of that vibration from the mean value.A positive peak value is the maximum positive deviation and a negative peak value is the maximum negative deviation. The mean value may be defined by 元=心t (7.1) This value in itself has been found to be of limited practical interest(Broch,1980)