6 CHAPTER 7.VIBRATION MONITORING The peak-to-peak(P-P)value is often used and defined as the difference between the extreme values of the vibration.A zero-to-peak (0-P)value is defined as one-half of the peak-to-peak value. Root mean square value (rms) The rms value of a function x(t)over an interval T is T Xrms Jo x(t)2dt T (7.2) rms values are widely used in industry for general monitoring purposes but do not necessarily show appreciable changes in the early stages of bearing damage.Similarly the change in vibration energy caused by gear defects accounts for only a small proportion of the total vibration energy.Therefore diagnostic methods such as measuring the peak value or total rms is generally not sensitive to early faults (Liu,Chen Zhang,1991). High frequency detection(HFD) Indications of the initial stages of a bearing fault can however apparently be achieved by trending the peak or rms levels of the high frequency response(Kadushin,1991). The vibration signal is bandpass filtered from 5 kHz to 40 kHz.A bearing defect imposes an impact force on the system structure.The system acceleration response signal is often enhanced by the high frequency transducer resonance.The signal is then enveloped by means of full wave rectification.The HFD parameter is the overall value of either the peak or rms level of the time wave form.By trending this value it is possible to determine if the bearing requires lubrication or if a fault is developing (Kadushin,1991). Crest factor The crest factor is the ratio of the peak level to the rms level: CP=Xmaz Xrms (7.3) The crest factor is a measure of the impulsiveness of a vibration signal.It is often used when dealing with shocks,impulsive noise and short events.The crest factor for a sine wave is 1.414,and the crest factor for a truly random noise signal is generally less than 3. The crest factor is commonly used to detect impulsive vibrations produced by damaged bearings.As a rule of thumb,good bearings have vibration crest factors of about 2.5 to 3.5,and damaged bearings have crest factors >3.5.Values as high as 7 can sometimes be recorded prior to failure. Crest factors are reliable only in the presence of significant impulsiveness.Crest fac- tors of a vibration signal are relatively insensitive to operating speed and bearing load, provided sufficient speed is maintained to generate a bearing vibration which is above the background level,and sufficient load is applied to maintain full contact.At higher oper- ating speeds both the peak and the rms values increase proportionally,giving a relatively constant crest factor.In the absence of significant impulsiveness,the reliability of the
7 crest factor to detect bearing damage breaks down.Typical examples include bearings with shallow defects which have no significant edge,bearings with advanced damage and bearings with a large number of defects or widespread damage (Norton,1989). Probability density The probability density p()(see paragraph 4.2.2)of the bearing vibration acceleration has been suggested to give an indication of the bearing condition.The probability density of a bearing in good condition has a Gaussian distribution of accelerations,whereas a damaged bearing results in a non-Gaussian distribution with a dominant tail,because of a relative increase in the number of high levels of acceleration.However some authors have reported near-Gaussian distributions in some damaged bearings also (Tandon Nakra, 1992): This ties in with an observation by Braun and Hammond(1986)that the probability density is insensitive to many variations of the signal pattern. Kurtosis A series of statistical methods can be used to define the shape of the probability density distribution.The first two statistical moments of a probability density distribution are the mean value and the mean-square value(see paragraph 4.2.1).The third statistical moment is the skewness of a distribution,which is a measure of the symmetry of the probability density function.The fourth statistical moment is widely used in machinery diagnostics, particularly for rolling element bearings.It is called kurtosis,and it is given by kurtosis 职=ne=人a (7.4) Because the fourth power is involved,the value of kurtosis is weighted towards the values in the tails of the probability density distributions-i.e.it is related to the spread in the distribution.As a general rule,odd statistical moments provide information about the disposition of the peak relative to the median value,and even statistical moments provide information about the shape of the probability distribution curve.The value of kurtosis for a Gaussian distribution is 3.A higher kurtosis value indicates that there is a larger spread of higher values than would generally be the case for a Gaussian distribution. The kurtosis of a signal is very useful for detecting the presence of an impulse within the signal.It is widely used for detecting discrete,impulsive faults in rolling element bearings.Good bearings tend to have a kurtosis value of about 3,and bearings with impulsive defects tend to have higher values (generally >4).The usage of kurtosis is however limited because,as the damage to a bearing becomes distributed,the impulsive content of the signal decreases with a subsequent decrease in the kurtosis value.This
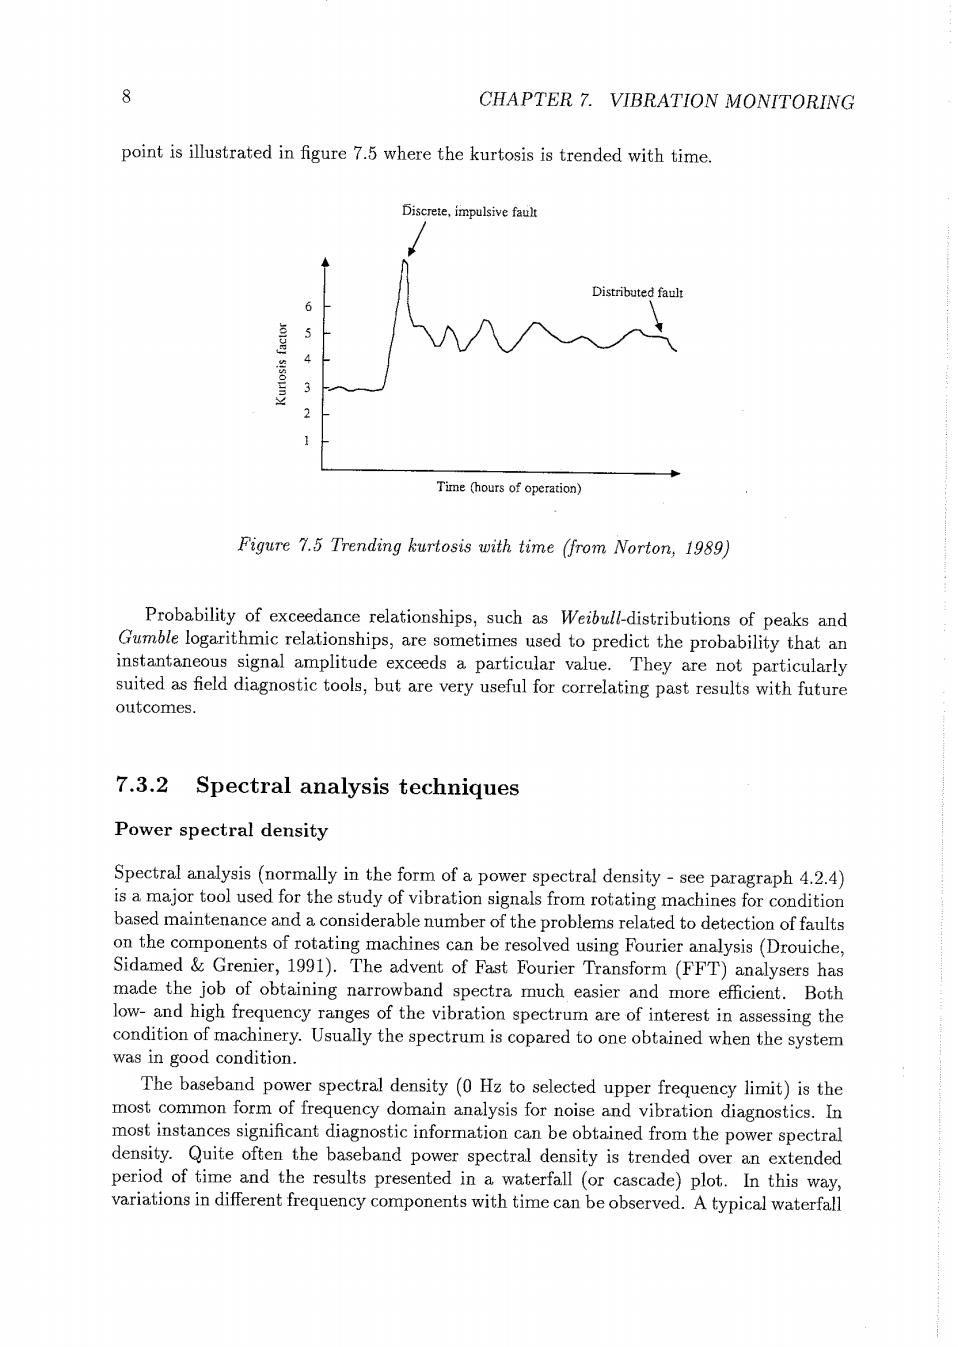
8 CHAPTER 7.VIBRATION MONITORING point is illustrated in figure 7.5 where the kurtosis is trended with time. Discrete,impulsive fault Distributed fault 5 4 Time (hours of operation) Figure 7.5 Trending kurtosis with time (from Norton,1989) Probability of exceedance relationships,such as Weibull-distributions of peaks and Gumble logarithmic relationships,are sometimes used to predict the probability that an instantaneous signal amplitude exceeds a particular value.They are not particularly suited as field diagnostic tools,but are very useful for correlating past results with future outcomes. 7.3.2 Spectral analysis techniques Power spectral density Spectral analysis (normally in the form of a power spectral density-see paragraph 4.2.4) is a major tool used for the study of vibration signals from rotating machines for condition based maintenance and a considerable number of the problems related to detection of faults on the components of rotating machines can be resolved using Fourier analysis(Drouiche, Sidamed Grenier,1991).The advent of Fast Fourier Transform(FFT)analysers has made the job of obtaining narrowband spectra much easier and more efficient.Both low-and high frequency ranges of the vibration spectrum are of interest in assessing the condition of machinery.Usually the spectrum is copared to one obtained when the system was in good condition. The baseband power spectral density(0 Hz to selected upper frequency limit)is the most common form of frequency domain analysis for noise and vibration diagnostics.In most instances significant diagnostic information can be obtained from the power spectral density.Quite often the baseband power spectral density is trended over an extended period of time and the results presented in a waterfall (or cascade)plot.In this way, variations in different frequency components with time can be observed.A typical waterfall
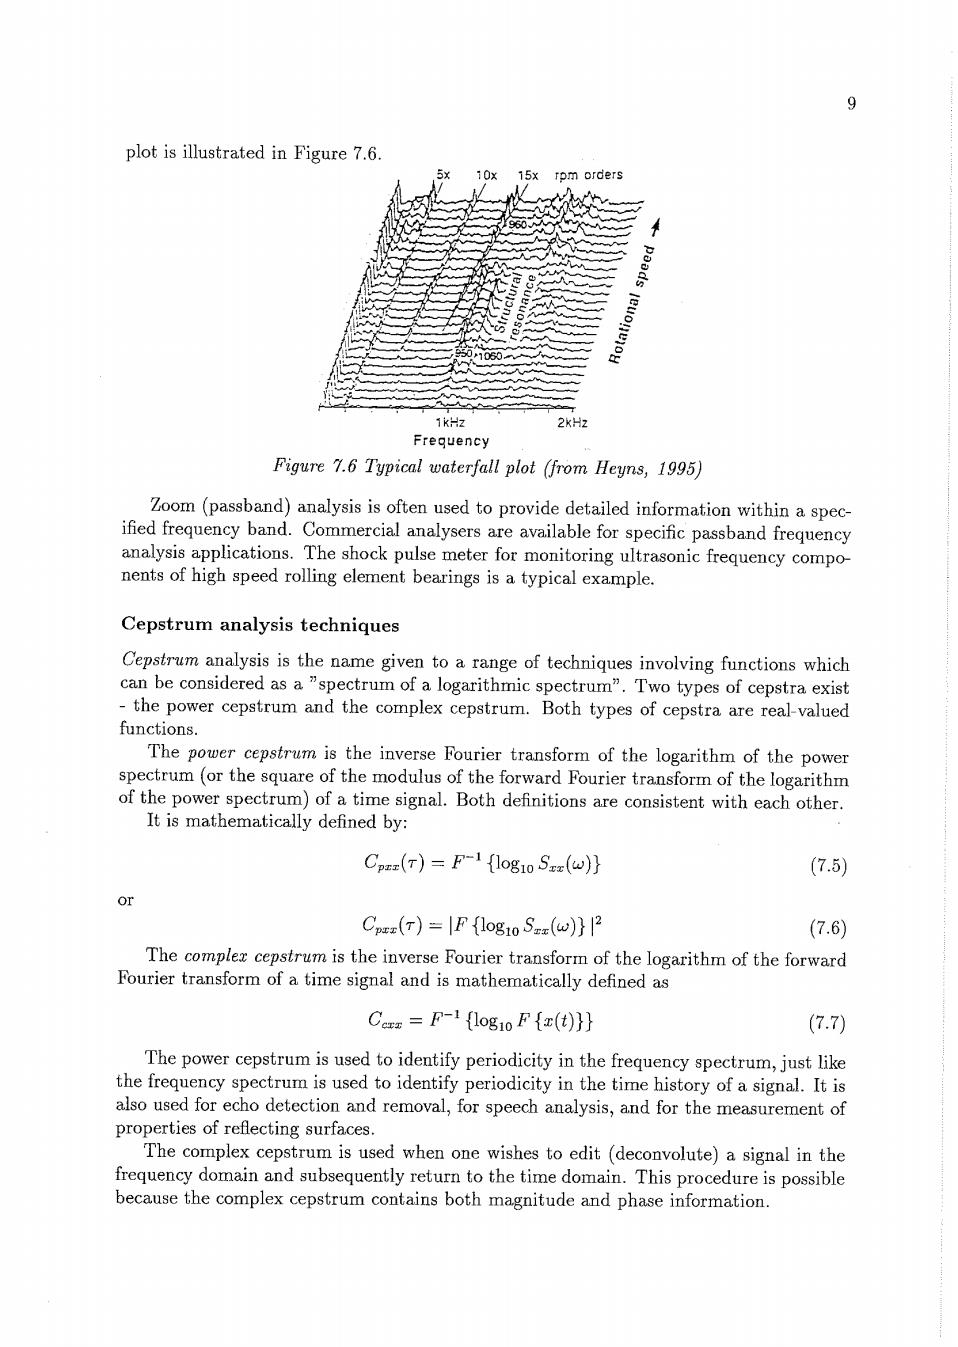
9 plot is illustrated in Figure 7.6. 10x 15x rpm orders 1kHz 2kHz Frequency Figure 7.6 Typical waterfall plot (from Heyns,1995) Zoom(passband)analysis is often used to provide detailed information within a spec- ified frequency band.Commercial analysers are available for specific passband frequency analysis applications.The shock pulse meter for monitoring ultrasonic frequency compo nents of high speed rolling element bearings is a typical example. Cepstrum analysis techniques Cepstrum analysis is the name given to a range of techniques involving functions which can be considered as a "spectrum of a logarithmic spectrum".Two types of cepstra exist the power cepstrum and the complex cepstrum.Both types of cepstra are real-valued functions. The power cepstrum is the inverse Fourier transform of the logarithm of the power spectrum(or the square of the modulus of the forward Fourier transform of the logarithm of the power spectrum)of a time signal.Both definitions are consistent with each other. It is mathematically defined by: Cp(T)=F-1{log1o Sz(w)} (7.5) Or Cp(T)=IF {1og1o S(w)}2 (7.6) The complex cepstrum is the inverse Fourier transform of the logarithm of the forward Fourier transform of a time signal and is mathematically defined as Ce =F-1 {log1o F{(t)}} (7.7) The power cepstrum is used to identify periodicity in the frequency spectrum,just like the frequency spectrum is used to identify periodicity in the time history of a signal.It is also used for echo detection and removal,for speech analysis,and for the measurement of properties of reflecting surfaces. The complex cepstrum is used when one wishes to edit (deconvolute)a signal in the frequency domain and subsequently return to the time domain.This procedure is possible because the complex cepstrum contains both magnitude and phase information