WeatherforecastingContents:IntroductionObservationsAnalysisForecastIntroductionBeforeaforecastcanbemadeofwhattheweatherislikelytobeinthefuture,aknowledgeofthepresentsituation is essential. Therefore, regular, reliable andaccurate measurements arerequired.Thesehave to berapidlysentaroundtheworldusingatelecommunicationssystemdedicatedtoweatherinformation.a96000Theobservationsare usedtoanalysetheweathepatternsataparticulartime.Oncetheanalysis hasbecarriedout,aforecastoftheweatherpattemcanbeFig1:Analvsisofmean-sea-levelpressure(isobars)andmade (usually with the aid of a computer).Theweatherfrontsfor00GMTon25October1990forecasterusestheoutputfromthecomputertodecidewhat the weather will be and to provide services to awide range of customers.100988Fig2:24-hourforecastofisobarsandrain(roundFig3:24-hourforecastofisobarsandweatherfrontssymbols indicate continuousrain andthe triangularprepared byaforecaster(basedon the outputfromthesymbolsindicateshowers)fromthecomputercomputermodel)for00GMTon26October1990
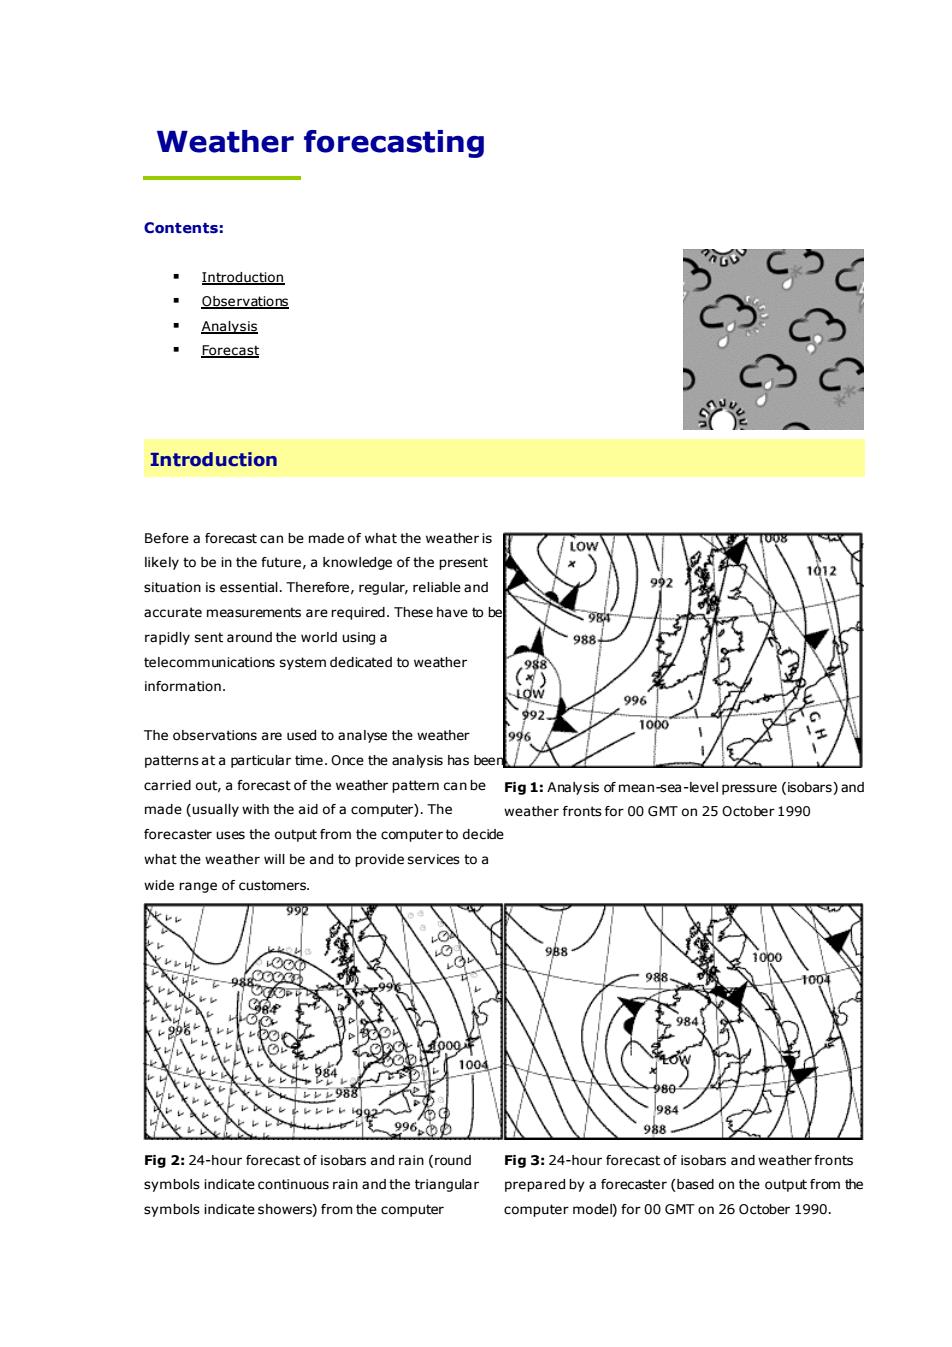
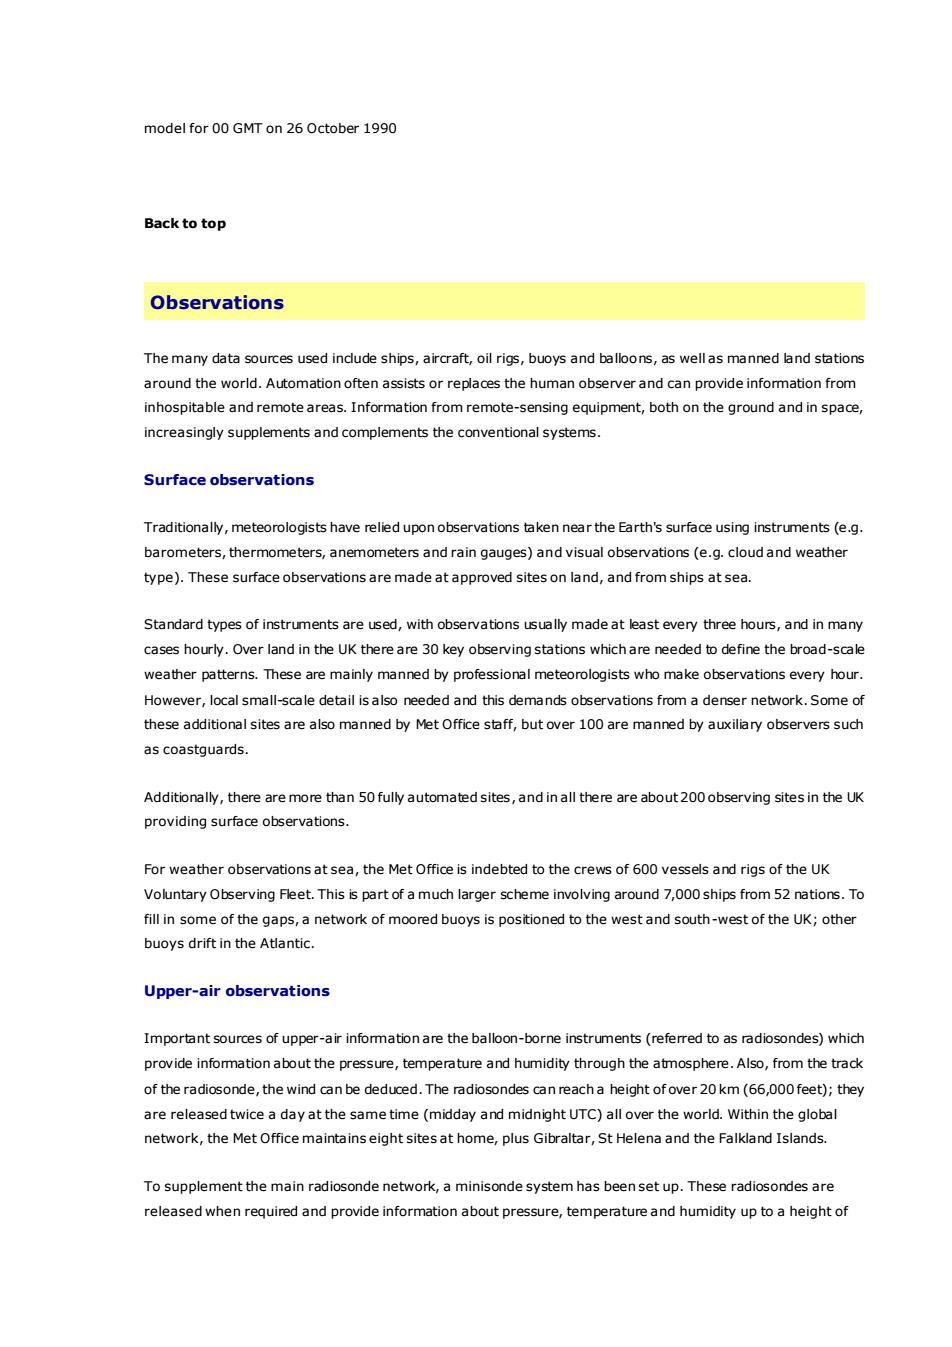
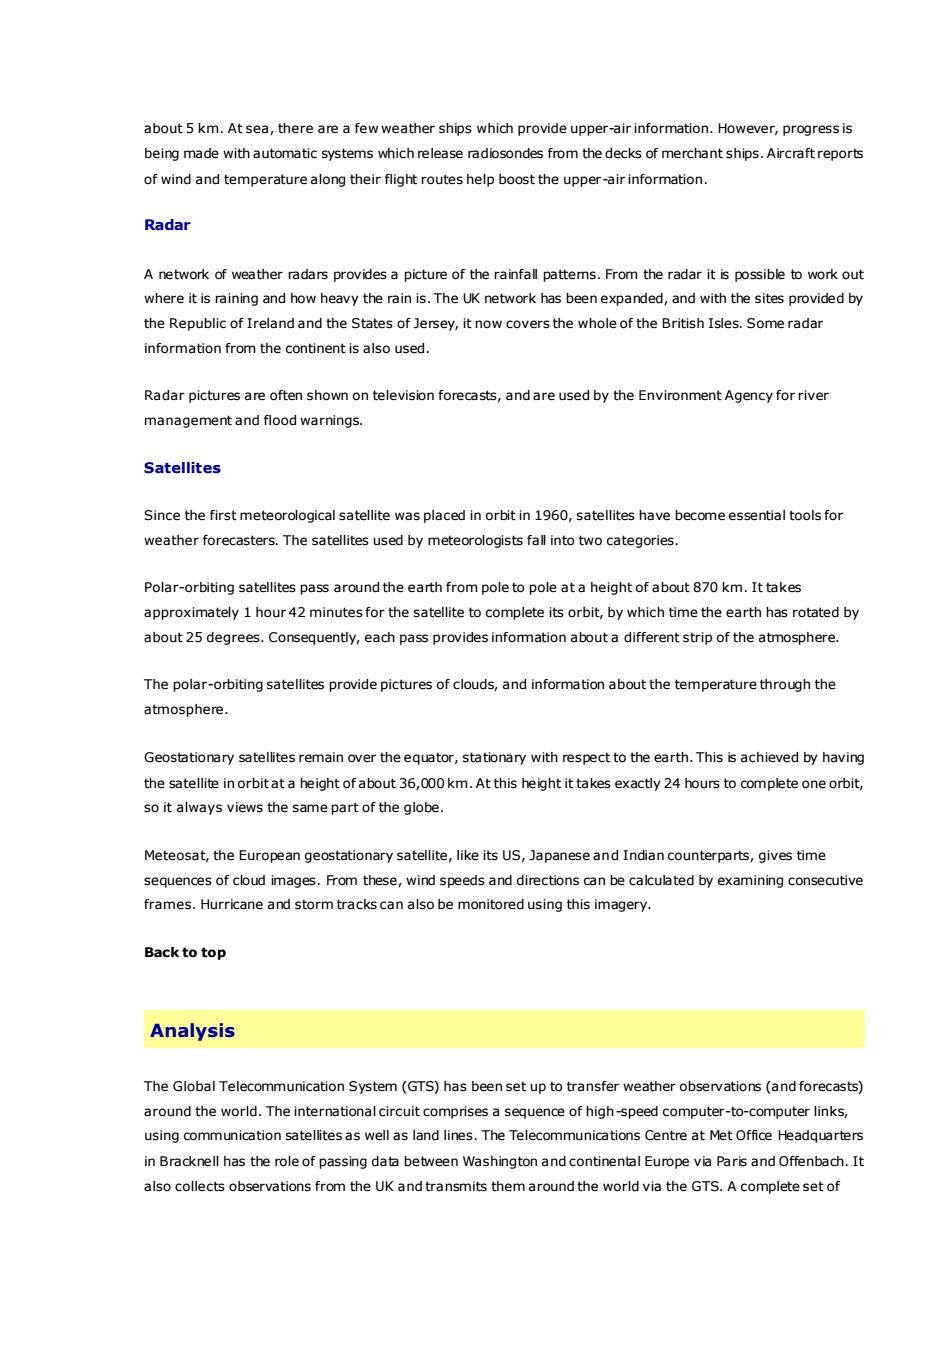
Weather forecasting Contents: ▪ Introduction ▪ Observations ▪ Analysis ▪ Forecast Introduction Before a forecast can be made of what the weather is likely to be in the future, a knowledge of the present situation is essential. Therefore, regular, reliable and accurate measurements are required. These have to be rapidly sent around the world using a telecommunications system dedicated to weather information. The observations are used to analyse the weather patterns at a particular time. Once the analysis has been carried out, a forecast of the weather pattern can be made (usually with the aid of a computer). The forecaster uses the output from the computer to decide what the weather will be and to provide services to a wide range of customers. Fig 1: Analysis of mean-sea-level pressure (isobars) and weather fronts for 00 GMT on 25 October 1990 Fig 2: 24-hour forecast of isobars and rain (round symbols indicate continuous rain and the triangular symbols indicate showers) from the computer Fig 3: 24-hour forecast of isobars and weather fronts prepared by a forecaster (based on the output from the computer model) for 00 GMT on 26 October 1990
modelfor00GMTon26October1990BacktotopObservationsThe many data sources used include ships, aircraft, oil rigs, buoys and balloons, as wellas manned land stationsaround theworld.Automation often assists or replaces thehuman observerand canprovide information frominhospitable and remoteareas. Information from remote-sensing equipment, both on the ground and in space,increasinglysupplementsandcomplementstheconventionalsystems.SurfaceobservationsTraditionally,meteorologists havereliedupon observationstakennearthe Earth's surfaceusing instruments (e.gbarometers,thermometers,anemometers andraingauges)andvisual observations(e.g.cloudandweathertype).Thesesurfaceobservations aremadeatapproved siteson land,andfromships at sea.Standard types of instruments are used, with observations usually made at least every three hours,and in manycases hourly.Over land in the UK there are 30 key observing stations whichare needed to define the broad-scaleweather patterns.These are mainly manned by professional meteorologists who make observations every hourHowever, local small-scale detail is also needed and this demands observations from a denser network.Some ofthese additional sites are also manned by Met Office staff, but over 100 are manned by auxiliary observers suchas coastguards.Additionally,there aremore than 50 fully automated sites,and in allthere areabout200 observing sites in the UKprovidingsurfaceobservations.For weather observations at sea, the Met Office is indebted to the crews of 600 vessels and rigs of the UKVoluntaryObserving Fleet.This is part of a much larger scheme involving around 7,000 ships from52 nations.Tofill in someof thegaps,a network ofmooredbuoys is positioned to thewestand south-westof theUK;otherbuoys drift in the Atlantic.Upper-airobservationsImportantsourcesofupper-airinformationaretheballoon-borneinstruments(referredtoasradiosondes)whichprovide information about the pressure,temperature and humidity through theatmosphere.Also,from the trackof the radiosonde,the wind can be deduced.The radiosondes can reacha height ofover 20 km (66,000feet); theyare released twice a day at the same time (midday and midnight UTC) all over the world. Within the globalnetwork, the Met Office maintainseight sites at home, plus Gibraltar,St Helena and the Falkland Islands.To supplement themain radiosonde network, a minisonde system has been set up.These radiosondes arereleased when required and provide information about pressure, temperature and humidity up to a height of
model for 00 GMT on 26 October 1990 Back to top Observations The many data sources used include ships, aircraft, oil rigs, buoys and balloons, as well as manned land stations around the world. Automation often assists or replaces the human observer and can provide information from inhospitable and remote areas. Information from remote-sensing equipment, both on the ground and in space, increasingly supplements and complements the conventional systems. Surface observations Traditionally, meteorologists have relied upon observations taken near the Earth's surface using instruments (e.g. barometers, thermometers, anemometers and rain gauges) and visual observations (e.g. cloud and weather type). These surface observations are made at approved sites on land, and from ships at sea. Standard types of instruments are used, with observations usually made at least every three hours, and in many cases hourly. Over land in the UK there are 30 key observing stations which are needed to define the broad-scale weather patterns. These are mainly manned by professional meteorologists who make observations every hour. However, local small-scale detail is also needed and this demands observations from a denser network. Some of these additional sites are also manned by Met Office staff, but over 100 are manned by auxiliary observers such as coastguards. Additionally, there are more than 50 fully automated sites, and in all there are about 200 observing sites in the UK providing surface observations. For weather observations at sea, the Met Office is indebted to the crews of 600 vessels and rigs of the UK Voluntary Observing Fleet. This is part of a much larger scheme involving around 7,000 ships from 52 nations. To fill in some of the gaps, a network of moored buoys is positioned to the west and south-west of the UK; other buoys drift in the Atlantic. Upper-air observations Important sources of upper-air information are the balloon-borne instruments (referred to as radiosondes) which provide information about the pressure, temperature and humidity through the atmosphere. Also, from the track of the radiosonde, the wind can be deduced. The radiosondes can reach a height of over 20 km (66,000 feet); they are released twice a day at the same time (midday and midnight UTC) all over the world. Within the global network, the Met Office maintains eight sites at home, plus Gibraltar, St Helena and the Falkland Islands. To supplement the main radiosonde network, a minisonde system has been set up. These radiosondes are released when required and provide information about pressure, temperature and humidity up to a height of
about5km.Atsea,there area fewweather ships which provideupper-airinformation.However,progress isbeing made with automatic systems which release radiosondes from the decks of merchant ships.Aircraftreportsof wind and temperature along their flight routes help boost the upper-air information.RadarA network of weather radars provides a picture of the rainfall pattems. From the radar it is possible to work outwhere it is raining and how heavy the rain is. The UK network has been expanded, and with the sites provided bythe Republic of Ireland and the States of Jersey, it now covers the whole of the British Isles. Some radarinformation from thecontinentisalsoused.Radar pictures are often shown on television forecasts, and are used by the Environment Agency for rivermanagement and flood warnings.SatellitesSince the firstmeteorological satellite wasplaced in orbit in196o,satellites have become essentialtools forweather forecasters.The satellites used by meteorologists fallinto two categories.Polar-orbiting satellites pass around the earth from pole to pole at a height of about 87o km. It takesapproximately 1 hour 42 minutesfor the satllite to complete its orbit, by which time the earth has rotated byabout 25 degrees. Consequently,each pass provides information about a different strip of the atmosphere.The polar-orbiting satellites provide pictures of clouds, and information about the temperature through theatmosphere.Geostationary satelites remain over the equator,stationary with respect to the earth. This is achieved by havingthe satellite in orbitata height ofabout36,000km.At this height ittakes exactly24hours to complete one orbitso italwaysviewsthesamepartoftheglobe.Meteosat,the Europeangeostationarysatellite,like its US,Japaneseand Indian counterparts,gives timesequences of cloud images.From these,wind speeds and directions can be calculated by examining consecutiveframes.Hurricane and stormtracks can also bemonitored using this imagery.BacktotopAnalysisThe GlobalTelecommunication System (GTS) has been set up to transfer weather observations (andforecasts)around the world.The internationalcircuit comprises a sequence of high-speed computer-to-computer links,using communication satellites as wellas land lines.The Telecommunications Centre at Met Office Headquartersin Bracknell has the role of passing data between Washington andcontinental Europevia Parisand Offenbach.Italso collects observations from the UK andtransmits themaround the worldvia the GTS.A complete set of
about 5 km. At sea, there are a few weather ships which provide upper-air information. However, progress is being made with automatic systems which release radiosondes from the decks of merchant ships. Aircraft reports of wind and temperature along their flight routes help boost the upper-air information. Radar A network of weather radars provides a picture of the rainfall patterns. From the radar it is possible to work out where it is raining and how heavy the rain is. The UK network has been expanded, and with the sites provided by the Republic of Ireland and the States of Jersey, it now covers the whole of the British Isles. Some radar information from the continent is also used. Radar pictures are often shown on television forecasts, and are used by the Environment Agency for river management and flood warnings. Satellites Since the first meteorological satellite was placed in orbit in 1960, satellites have become essential tools for weather forecasters. The satellites used by meteorologists fall into two categories. Polar-orbiting satellites pass around the earth from pole to pole at a height of about 870 km. It takes approximately 1 hour 42 minutes for the satellite to complete its orbit, by which time the earth has rotated by about 25 degrees. Consequently, each pass provides information about a different strip of the atmosphere. The polar-orbiting satellites provide pictures of clouds, and information about the temperature through the atmosphere. Geostationary satellites remain over the equator, stationary with respect to the earth. This is achieved by having the satellite in orbit at a height of about 36,000 km. At this height it takes exactly 24 hours to complete one orbit, so it always views the same part of the globe. Meteosat, the European geostationary satellite, like its US, Japanese and Indian counterparts, gives time sequences of cloud images. From these, wind speeds and directions can be calculated by examining consecutive frames. Hurricane and storm tracks can also be monitored using this imagery. Back to top Analysis The Global Telecommunication System (GTS) has been set up to transfer weather observations (and forecasts) around the world. The international circuit comprises a sequence of high-speed computer-to-computer links, using communication satellites as well as land lines. The Telecommunications Centre at Met Office Headquarters in Bracknell has the role of passing data between Washington and continental Europe via Paris and Offenbach. It also collects observations from the UK and transmits them around the world via the GTS. A complete set of
observationsfromtheUk isavailableabouttenminutespastthehourofobservation.Thereare,however,twopotentialdifficultiesinusingtheobservations.Firstly,theobservationsmaybeinaccurate(e.g.instrumentsmaynotbefunctioningproperlyortheremaybetransmissionerrors)andsecondhtherearesomeregions(e.g.overtheoceans)wheretherearefewobservations.Theobservations takenfrom theGTSarestoredoncomputerandareanalysedintwodifferent ways.The observations at a specific time23.900areplottedonachart.ThesechartsarethentheanalysedbyZ2.300craltLaterforecasters (with the aid of satellite00staand radar information) in order toale5.10understand whatis goingon in thesatellae2geratmosphere.Forexample,linesoftadalconstantpressure(isobars)aredrawn, and these help identifyimportant weather features such asinterdepressions,andanticyclonesfronts.Forecasters also use theseGlobalNational and Internationalcharts to make short-term localforecast services up to 7 days aheadcastservice.forecasts.VTThe observationsareusedto definercommercethestarting conditions of theatmosphereforacomputerforecastwhich cango asfar as six daysno09/1190ahead. The flow of information fromobservationsto forecasts.TheFig 4:The flow of information fromobservations toforecasts.Thenumbers give an indication of hownumbersgiveanindicationofhowmanyobservationsareusedmany observations are used eacheach24-hourperiodas abasisfortheglobalforecasts.24-hour period as a basis for theglobalforecastsBacktotopForecastTheuseofcomputers has played akeyrole in improvingthe accuracy anddetail ofweatherforecasts,and in
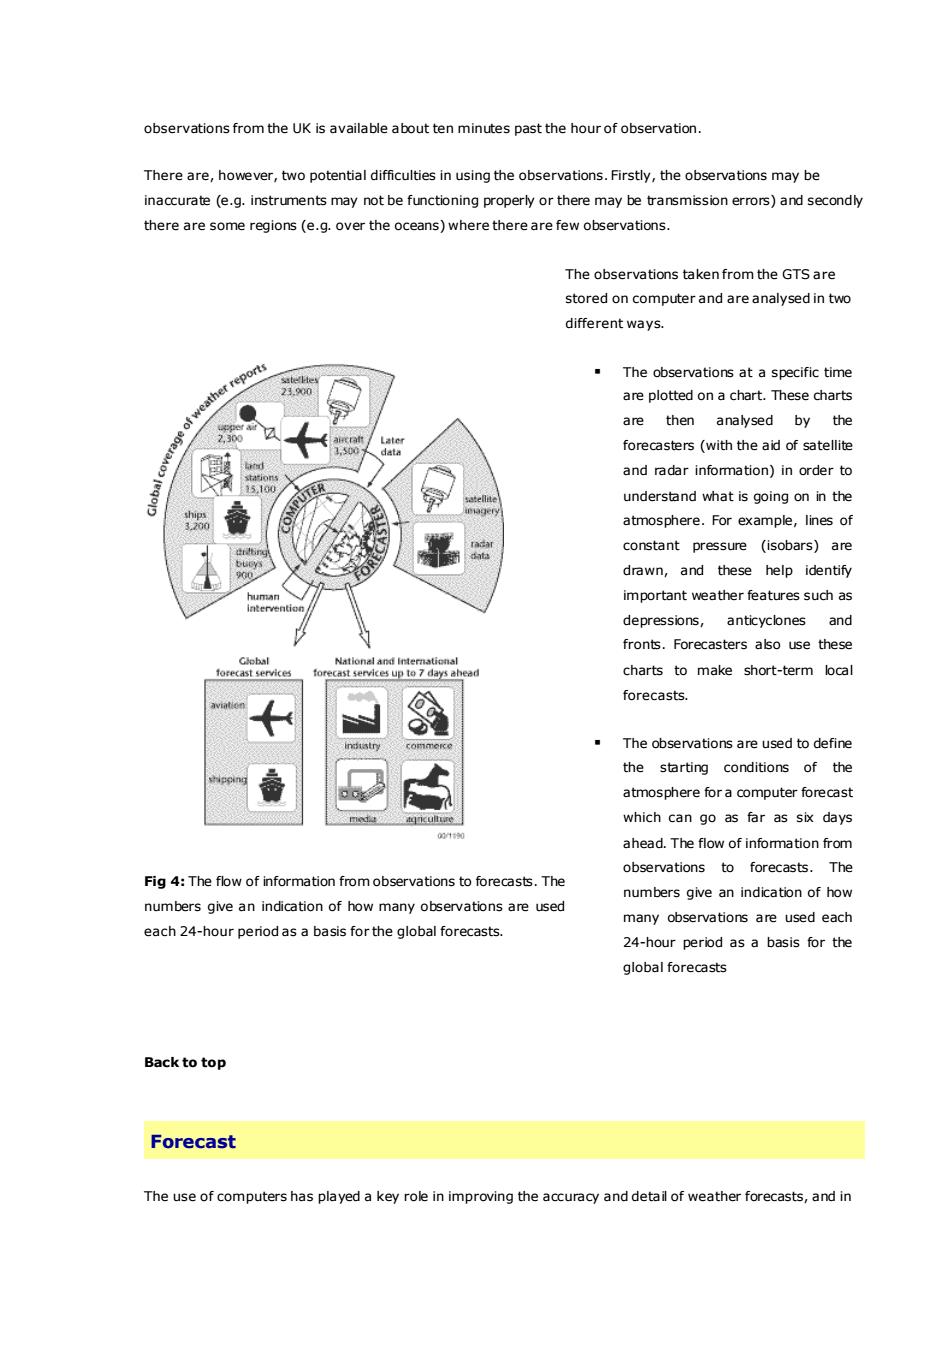
observations from the UK is available about ten minutes past the hour of observation. There are, however, two potential difficulties in using the observations. Firstly, the observations may be inaccurate (e.g. instruments may not be functioning properly or there may be transmission errors) and secondly there are some regions (e.g. over the oceans) where there are few observations. Fig 4: The flow of information from observations to forecasts. The numbers give an indication of how many observations are used each 24-hour period as a basis for the global forecasts. The observations taken from the GTS are stored on computer and are analysed in two different ways. ▪ The observations at a specific time are plotted on a chart. These charts are then analysed by the forecasters (with the aid of satellite and radar information) in order to understand what is going on in the atmosphere. For example, lines of constant pressure (isobars) are drawn, and these help identify important weather features such as depressions, anticyclones and fronts. Forecasters also use these charts to make short-term local forecasts. ▪ The observations are used to define the starting conditions of the atmosphere for a computer forecast which can go as far as six days ahead. The flow of information from observations to forecasts. The numbers give an indication of how many observations are used each 24-hour period as a basis for the global forecasts Back to top Forecast The use of computers has played a key role in improving the accuracy and detail of weather forecasts, and in
lengtheningtheperiodforwhichuseful guidancecanbegiven.Thecalculationsinvovedarebothnumerousandcomplexand mustbeperfomed quickly so thatforecasts areavailable ingood time.Consequently,someof themost powerful computers in the worldare needed.ThecomputermodelWeatherforecastsarebased on the solutionofa setofmathematicalequations describing certainphysicalprocesses in the atmosphere. To solve these complex equations it is first necessary to divide the atmosphere upinto boxes,withagridpoint inthe centre ofeach box.Theproperties of theatmospherearethen represented bywhat is happening at each of the gridpoints. The array of gridpoints, the system of equations and the method ofsolvingtheequations isreferredtoasthemodel.Inthepresent global model used bythe Met Office,there isaspacing of roughly 60 km between each gridpoint in the horizontal. The gridpoints are also arranged in 30 verticallevelsthroughtheatmosphere.DCRadiation fromFormationodthesuerainadsneRadiationfronmMountainFammatienofthe atrmosphereeffecdoudsRadiationearthfrkction朵余Fig5:SomeofthephysicalprocessesrepresentedincomputermodelsusedtoforecasttheweatherTheobservationstakenataparticulartimecanbeusedtocomputevaluesforeachgridpointof pressuretemperature, humidity and wind. This set of values (the computer analysis) then represents the atmosphere atthestartoftheforecast.Usingthemathematicaleguations,a15-minuteforecastcanbemadeofhowthesebasicelements change.Once all the newvalues have been calculated, the process starts again withanother15-minuteforecastbeingmade.Byrepeatingthisproceduremanytimesover,aforecastouttosixdayscanbebuiltup.Thesupercomputeratthe Met Office onlytakes about an hourtoproducea six-dayglobal forecast.The computermodel produces a global forecast twicea dayusing themidnight and midday observations asstarting conditions.In orderto provide more-detailed forecastcharts out to 36 hours for the UK and parts of theAtlanticand Europe,themodelis run againat0600and1800dailyForlocalforecastsupto18hours,theMetOfficehasdevelopedamodelwhichhasan11kmhorizontalgridandcovers the British Isles and the near continent. This'mesoscale model' is especially good at taking into accountthe local effect of hills and valleys and the contrast betweenland and sea in its forecasts
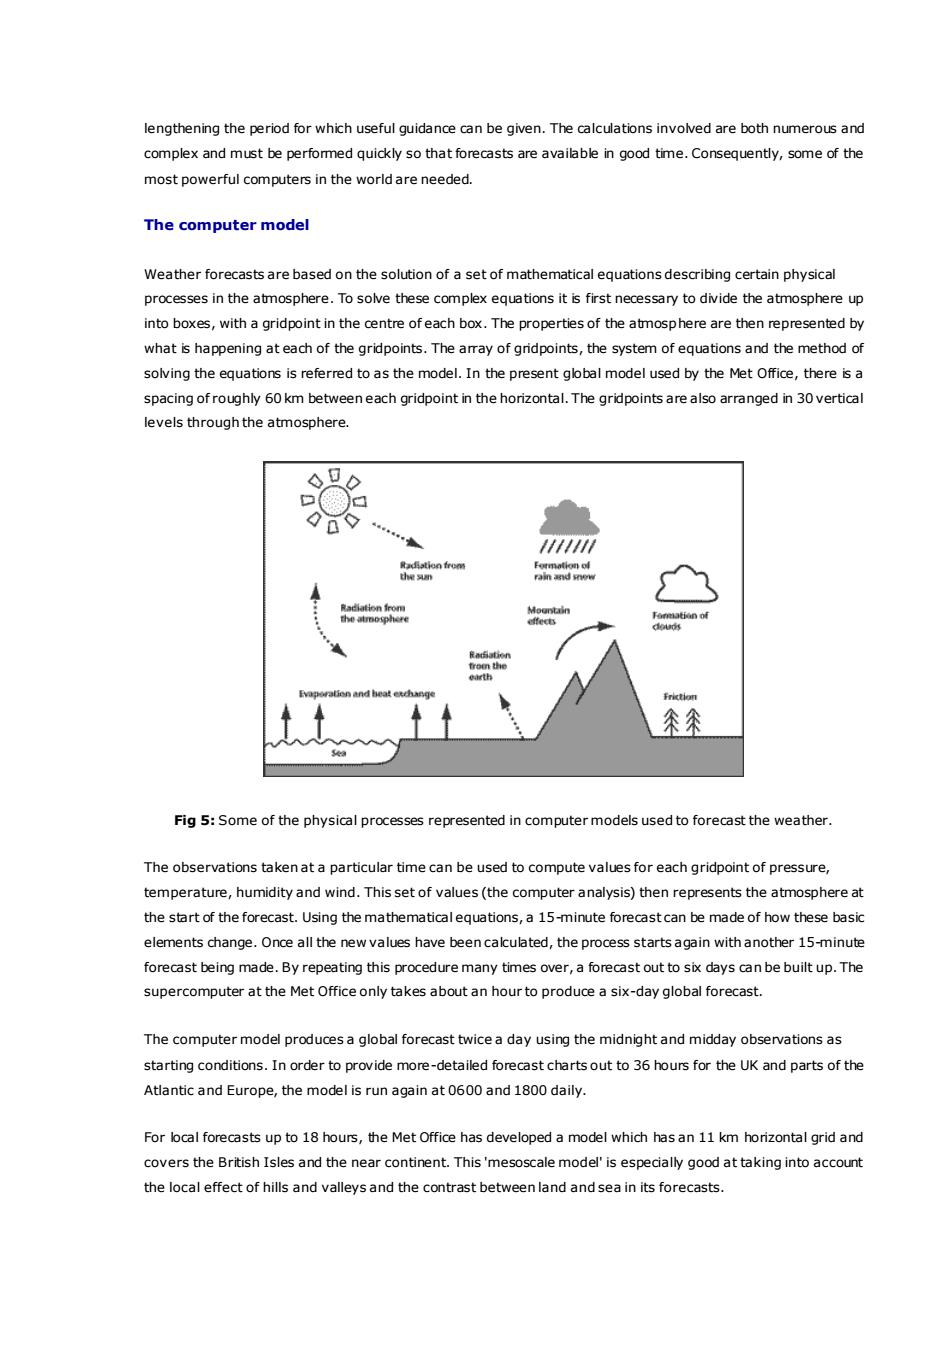
lengthening the period for which useful guidance can be given. The calculations involved are both numerous and complex and must be performed quickly so that forecasts are available in good time. Consequently, some of the most powerful computers in the world are needed. The computer model Weather forecasts are based on the solution of a set of mathematical equations describing certain physical processes in the atmosphere. To solve these complex equations it is first necessary to divide the atmosphere up into boxes, with a gridpoint in the centre of each box. The properties of the atmosphere are then represented by what is happening at each of the gridpoints. The array of gridpoints, the system of equations and the method of solving the equations is referred to as the model. In the present global model used by the Met Office, there is a spacing of roughly 60 km between each gridpoint in the horizontal. The gridpoints are also arranged in 30 vertical levels through the atmosphere. Fig 5: Some of the physical processes represented in computer models used to forecast the weather. The observations taken at a particular time can be used to compute values for each gridpoint of pressure, temperature, humidity and wind. This set of values (the computer analysis) then represents the atmosphere at the start of the forecast. Using the mathematical equations, a 15-minute forecast can be made of how these basic elements change. Once all the new values have been calculated, the process starts again with another 15-minute forecast being made. By repeating this procedure many times over, a forecast out to six days can be built up. The supercomputer at the Met Office only takes about an hour to produce a six-day global forecast. The computer model produces a global forecast twice a day using the midnight and midday observations as starting conditions. In order to provide more-detailed forecast charts out to 36 hours for the UK and parts of the Atlantic and Europe, the model is run again at 0600 and 1800 daily. For local forecasts up to 18 hours, the Met Office has developed a model which has an 11 km horizontal grid and covers the British Isles and the near continent. This 'mesoscale model' is especially good at taking into account the local effect of hills and valleys and the contrast between land and sea in its forecasts