seats were elected from 73 single-member districts,with a much smaller portion of seats being produced by proportional representation party votes that cross the 5%threshold. Such a winner-takes-all game not only marginalized smaller parties psychologically,but also created mechanically a big gap between vote and seat shares (38.2%vs.23.9%)of the DPP in the 2008 legislative election.3 Such a game continued in 2012 when the KMT obtained 56.5%of seats with 48.2%of district votes and 44.6%of party votes,and the DPP gained only 35.4%of seats despite 43.8%percent of district votes.Meanwhile,the two tiny parties,the PFP and the TSU crossed the 5%threshold of party votes and gained three seats each.However,because the reduced gap between the KMT and the DPP in seat shares,the effective number of parliamentary parties in 2012 (2.23)is closer to the standard value (2.0)for the two party system than the figure in 2008(1.73),should we employ the definition and calculative formula proposed by Markku Laakso and Rein Taagepera (Ns=1/>vs ).4 The electoral outcomes before and since 2008 have demonstrated the effectiveness of institutional variables in shaping Taiwan's two-party system in the legislative system.The KMT and the DPP now have 56.6%and 35.4%of seats respectively,while the PFP or the TSU has less than 3%of seats,which may vanish in the 2016 legislative election due to the decreasing influence of PFP's chairman James Soong and TSU's spiritual leader Lee Teng-hui.Among the 73 district seats,the KMT enjoys 44 while the DPP has 27.Despite the big difference of seat shares of the two parties,the gap of their vote shares is not so big (48.2%vs.43.8%for district votes).Should party votes gained by the PFP and the TSU be converted respectively to the KMT and the TSU during next legislative election,their seat shares ratio might be 9:8.District seat shares may be drawn closer as well if the DPP can get more votes next time. The gap between vote and seat shares of the two parties is the mechanical function of the single-member-district system.Another function of the system is favoring the incumbents.During the 2012 legislative election,60 district members ran for reelections and 45 won the campaigns,accounting for 61.6%of district seats.Among the 73 districts, 19(26%)experienced power turnovers from one party to another.As a result,district seats owned by the DPP increased from 13 in 2008 to 27 in 2012.If similar changes happen again in 2016,the KMT would no longer maintain or even lose its majority position (64 versus 40 seats)in the current legislative organ. Table 3 Vote and Seat Shares in Legislative Elections(1992-2012) Year 1992 1995 1998 2001 2004 2008 2012 Total seats 161 164 225 225 225 113 113 KMT Vote% 52.7% 46.1% 46.4% 28.6% 32.8% 53.5%(51.2%) 48.2%(44.6%) Seat% 58.4% 51.8% 55.1% 30.2% 35.1 71.9% 56.6% DPP Vote% 31.4% 33.2% 29.6% 33.4% 35.7% 38.2%(36.9%) 43.8%(34.6%) Seat% 31.7% 32.9% 31.1% 38.7% 39.6% 23.9% 35.4% 3 Maurice Duverger has made a conceptual distinction between psychological and mechanical effectiveness of single-member-district plurality system on the number of relevant parliamentary parties.See Maurice Duverger,Political Parties (London:Lowe &Brydone Ltd,1964),pp.224-226. 4 Markku Laakso and Rein Taagepera,"Effective Number of Parties:A Measure with Application to West Europe," Comparative Political Studies,Vol.12,No.12(1979),pp.3-27. 6
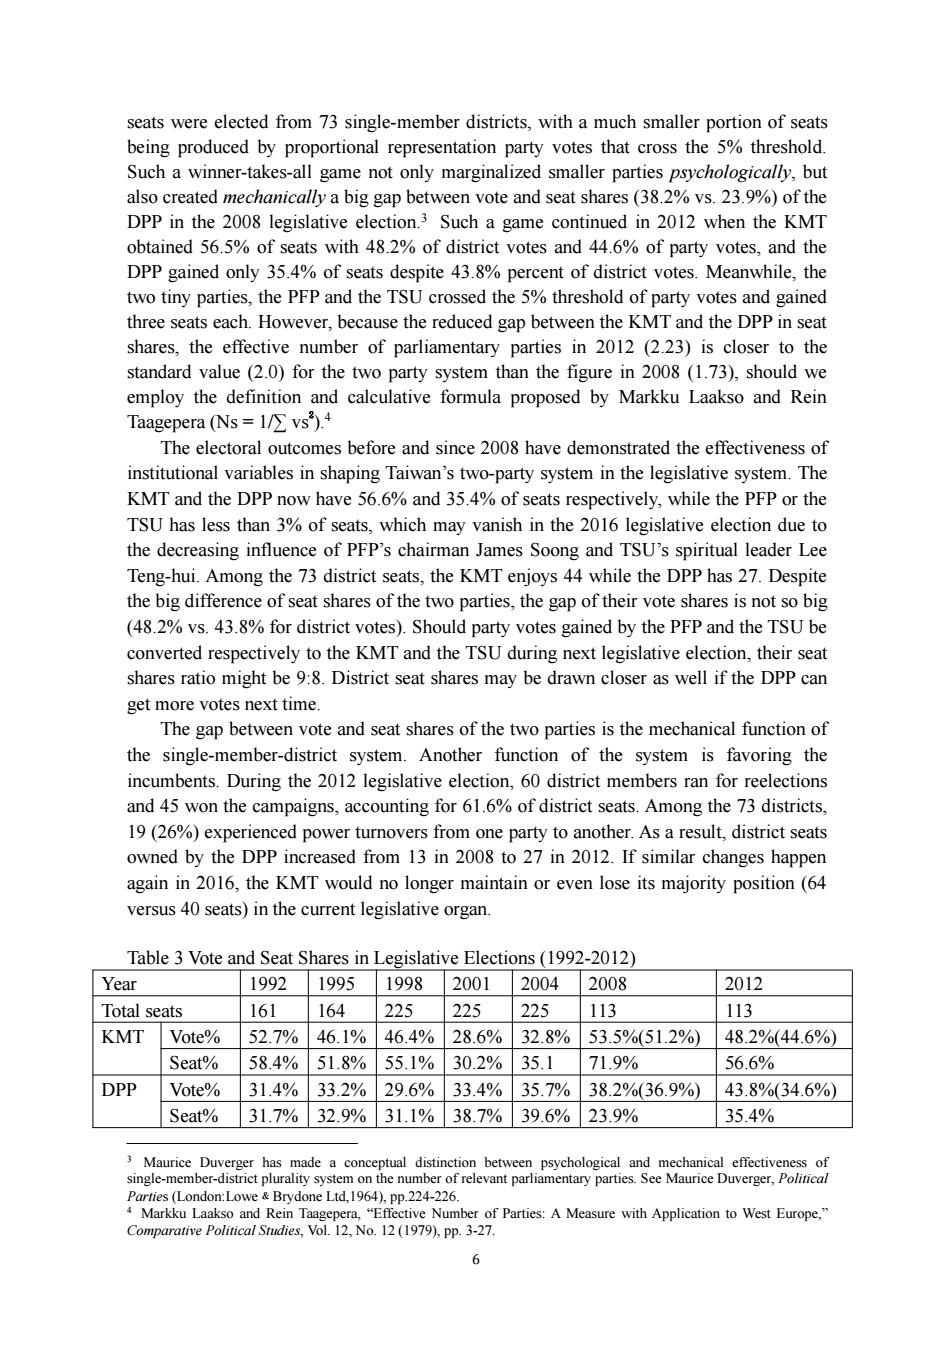
6 seats were elected from 73 single-member districts, with a much smaller portion of seats being produced by proportional representation party votes that cross the 5% threshold. Such a winner-takes-all game not only marginalized smaller parties psychologically, but also created mechanically a big gap between vote and seat shares (38.2% vs. 23.9%) of the DPP in the 2008 legislative election.3 Such a game continued in 2012 when the KMT obtained 56.5% of seats with 48.2% of district votes and 44.6% of party votes, and the DPP gained only 35.4% of seats despite 43.8% percent of district votes. Meanwhile, the two tiny parties, the PFP and the TSU crossed the 5% threshold of party votes and gained three seats each. However, because the reduced gap between the KMT and the DPP in seat shares, the effective number of parliamentary parties in 2012 (2.23) is closer to the standard value (2.0) for the two party system than the figure in 2008 (1.73), should we employ the definition and calculative formula proposed by Markku Laakso and Rein Taagepera (Ns = 1/∑ vs 2).4 The electoral outcomes before and since 2008 have demonstrated the effectiveness of institutional variables in shaping Taiwan’s two-party system in the legislative system. The KMT and the DPP now have 56.6% and 35.4% of seats respectively, while the PFP or the TSU has less than 3% of seats, which may vanish in the 2016 legislative election due to the decreasing influence of PFP’s chairman James Soong and TSU’s spiritual leader Lee Teng-hui. Among the 73 district seats, the KMT enjoys 44 while the DPP has 27. Despite the big difference of seat shares of the two parties, the gap of their vote shares is not so big (48.2% vs. 43.8% for district votes). Should party votes gained by the PFP and the TSU be converted respectively to the KMT and the TSU during next legislative election, their seat shares ratio might be 9:8. District seat shares may be drawn closer as well if the DPP can get more votes next time. The gap between vote and seat shares of the two parties is the mechanical function of the single-member-district system. Another function of the system is favoring the incumbents. During the 2012 legislative election, 60 district members ran for reelections and 45 won the campaigns, accounting for 61.6% of district seats. Among the 73 districts, 19 (26%) experienced power turnovers from one party to another. As a result, district seats owned by the DPP increased from 13 in 2008 to 27 in 2012. If similar changes happen again in 2016, the KMT would no longer maintain or even lose its majority position (64 versus 40 seats) in the current legislative organ. Table 3 Vote and Seat Shares in Legislative Elections (1992-2012) Year 1992 1995 1998 2001 2004 2008 2012 Total seats 161 164 225 225 225 113 113 KMT Vote% 52.7% 46.1% 46.4% 28.6% 32.8% 53.5%(51.2%) 48.2%(44.6%) Seat% 58.4% 51.8% 55.1% 30.2% 35.1 71.9% 56.6% DPP Vote% 31.4% 33.2% 29.6% 33.4% 35.7% 38.2%(36.9%) 43.8%(34.6%) Seat% 31.7% 32.9% 31.1% 38.7% 39.6% 23.9% 35.4% 3 Maurice Duverger has made a conceptual distinction between psychological and mechanical effectiveness of single-member-district plurality system on the number of relevant parliamentary parties. See Maurice Duverger, Political Parties (London:Lowe﹠Brydone Ltd,1964), pp.224-226. 4 Markku Laakso and Rein Taagepera, “Effective Number of Parties: A Measure with Application to West Europe,” Comparative Political Studies, Vol. 12, No. 12 (1979), pp. 3-27
NP Vote 13.0% 7.1% 2.6% 0.1% 0%(3.95%) 0.08%(1.49%) Seat% 12.8% 4.89% 0.4% 0.4% 0 0 PFP Vote 18.6% 13.9% 0.29%(0%) 1.33%(5.49%) Seat% 20.4% 15.1% 0.88% 2.65% TSU Vote 7.8% 7.8% 0.96%(3.53%) 0%(8.96%) Seat% 5.8% 5.3% 0 2.65% Source:Central Election Commission.Taiwan.Figures in parenthesis are the percentages of party votes. Taiwan started direct presidential election in 1996.For the first two elections,more than two candidates ran for the presidency and candidates of the two main parties received 75.1%of votes in 1996 and 62.4%of votes in 2000.Since 2004,presidential election has mainly become a game for the KMT and the DPP only.This suggests again that the plurality system is in favor of a two-party system.One can expect this two-party game to repeat in 2016 and the DPP may come back to power.As mentioned above,the KMT nowadays controls only one metropolis and five counties,with 26.78%of the total population.Over the past three presidential elections,party candidate tended to get more votes in districts under the same party's control.For example,during the 2004 presidential election,the DPP candidate Chen Shui-bian won majority votes in Green districts except for Taipei and Nantou counties,while the KMT candidate Lien Chan also obtained majority votes in Blue districts except for Taichung and Yunlin counties.During the 2008 presidential election,the KMT candidate Ma Ying-jeou (Ma Yingjiu)won majority votes in all Blue districts,the DPP candidate Hsieh Chang-ting obtained majority votes in all five Green counties,while getting slightly fewer votes than Ma in Taiwan and Kaohsiung cities which were also under the DPP's control.During the 2012 election,Ma Ying-jeou again won majority votes in all Blue districts except for Chiayi (Jiayi)City,and the DPP's Tsai Ing-wen(Cai Yingwen)won majority votes in Green districts without any exception.3 Given the DPP held less than one third of the population during the 2008 and 2012 elections,one cannot help but speculate that the party is very likely to win the 2016 presidential election,as it holds more than two thirds of the population in the wake of the 2014 elections.6 Furthermore,the KMT's actual vote share in the 2014 local executive elections has been unprecedentedly far behind the DPP's(11.2%),which makes it difficult for the KMT to catch up in the forthcoming presidential election.In the past presidential elections,the DPP dropped about 3%(2008 and 2012)or 5%(2000)vote share from that in previous local executive elections.Unless the DPP drops more than 5.6%vote share in the 2016 election,it would not lose the battle to the KMT. Table 4 Vote Shares of Different Parties in Presidential Elections(%) 1996 2000 2004 2008 2012 KMT 54.00 23.10 49.89 58.45 51.60 DPP 21.13 39.30 50.11 41.45 45.63 Others 14.90a 36.84c 2.77c s Lin Gang,A Stdy on Party Politics in Taiwan [Taiwan diqu zhengdang zhengzhi yanjiu](Chinese Social Sciences Press,2014,pp.148-49. Including population of Taipei Metropolis which is under the leadership of the pro-DPP Mayor Ko Wen-je
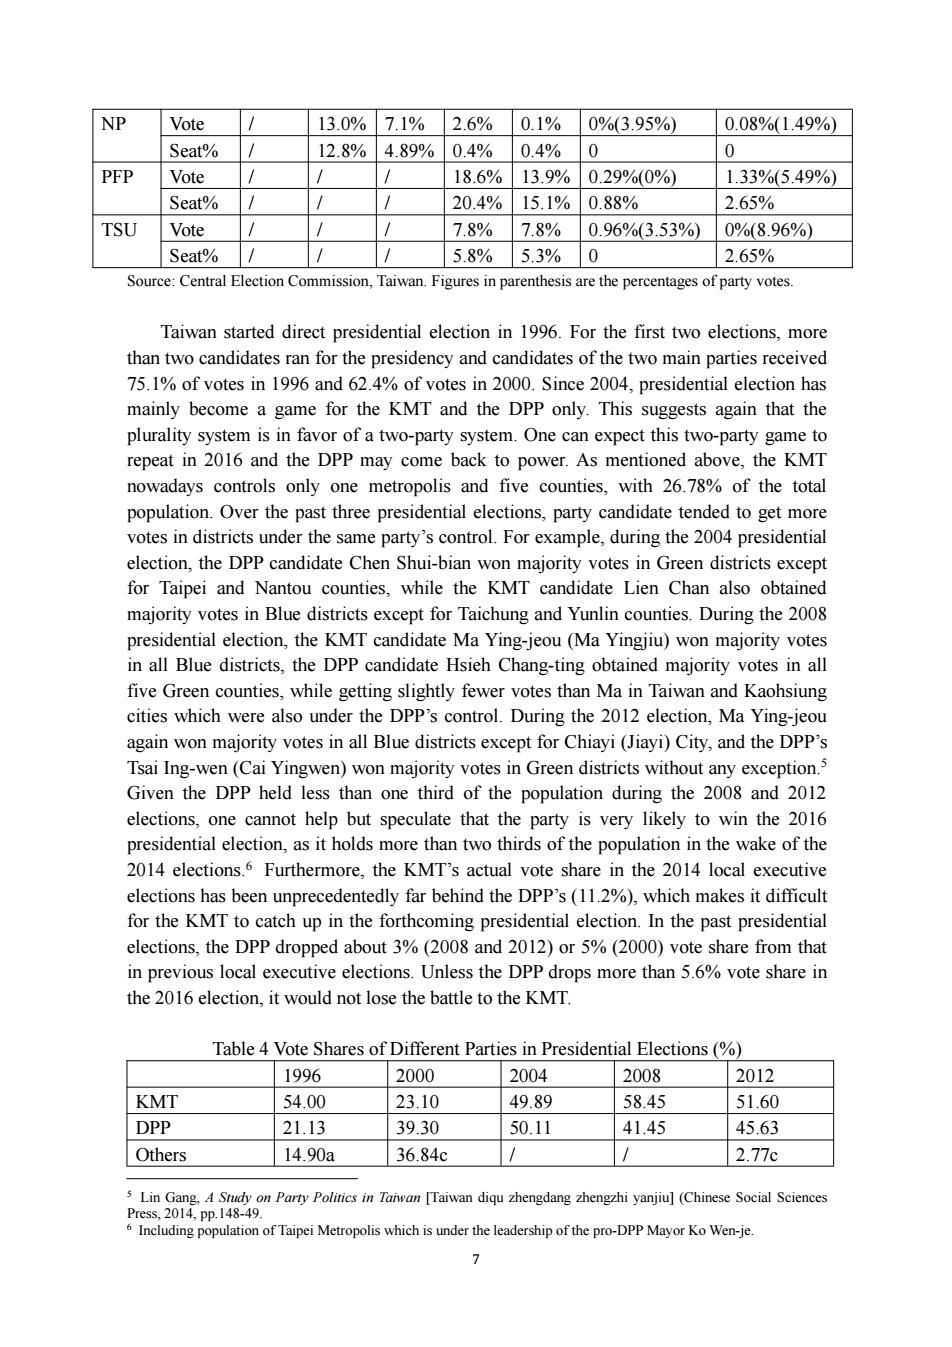
7 NP Vote / 13.0% 7.1% 2.6% 0.1% 0%(3.95%) 0.08%(1.49%) Seat% / 12.8% 4.89% 0.4% 0.4% 0 0 PFP Vote / / / 18.6% 13.9% 0.29%(0%) 1.33%(5.49%) Seat% / / / 20.4% 15.1% 0.88% 2.65% TSU Vote / / / 7.8% 7.8% 0.96%(3.53%) 0%(8.96%) Seat% / / / 5.8% 5.3% 0 2.65% Source: Central Election Commission, Taiwan. Figures in parenthesis are the percentages of party votes. Taiwan started direct presidential election in 1996. For the first two elections, more than two candidates ran for the presidency and candidates of the two main parties received 75.1% of votes in 1996 and 62.4% of votes in 2000. Since 2004, presidential election has mainly become a game for the KMT and the DPP only. This suggests again that the plurality system is in favor of a two-party system. One can expect this two-party game to repeat in 2016 and the DPP may come back to power. As mentioned above, the KMT nowadays controls only one metropolis and five counties, with 26.78% of the total population. Over the past three presidential elections, party candidate tended to get more votes in districts under the same party’s control. For example, during the 2004 presidential election, the DPP candidate Chen Shui-bian won majority votes in Green districts except for Taipei and Nantou counties, while the KMT candidate Lien Chan also obtained majority votes in Blue districts except for Taichung and Yunlin counties. During the 2008 presidential election, the KMT candidate Ma Ying-jeou (Ma Yingjiu) won majority votes in all Blue districts, the DPP candidate Hsieh Chang-ting obtained majority votes in all five Green counties, while getting slightly fewer votes than Ma in Taiwan and Kaohsiung cities which were also under the DPP’s control. During the 2012 election, Ma Ying-jeou again won majority votes in all Blue districts except for Chiayi (Jiayi) City, and the DPP’s Tsai Ing-wen (Cai Yingwen) won majority votes in Green districts without any exception.5 Given the DPP held less than one third of the population during the 2008 and 2012 elections, one cannot help but speculate that the party is very likely to win the 2016 presidential election, as it holds more than two thirds of the population in the wake of the 2014 elections.6 Furthermore, the KMT’s actual vote share in the 2014 local executive elections has been unprecedentedly far behind the DPP’s (11.2%), which makes it difficult for the KMT to catch up in the forthcoming presidential election. In the past presidential elections, the DPP dropped about 3% (2008 and 2012) or 5% (2000) vote share from that in previous local executive elections. Unless the DPP drops more than 5.6% vote share in the 2016 election, it would not lose the battle to the KMT. Table 4 Vote Shares of Different Parties in Presidential Elections (%) 1996 2000 2004 2008 2012 KMT 54.00 23.10 49.89 58.45 51.60 DPP 21.13 39.30 50.11 41.45 45.63 Others 14.90a 36.84c / / 2.77c 5 Lin Gang, A Study on Party Politics in Taiwan [Taiwan diqu zhengdang zhengzhi yanjiu] (Chinese Social Sciences Press, 2014, pp.148-49. 6 Including population of Taipei Metropolis which is under the leadership of the pro-DPP Mayor Ko Wen-je