P 100 50 20 K/p 0 P=.7 当n很大时,kn在均值P处呈尖峰分布: 的=P,an哈=Pl-P/n 因此: P≈ 5/27
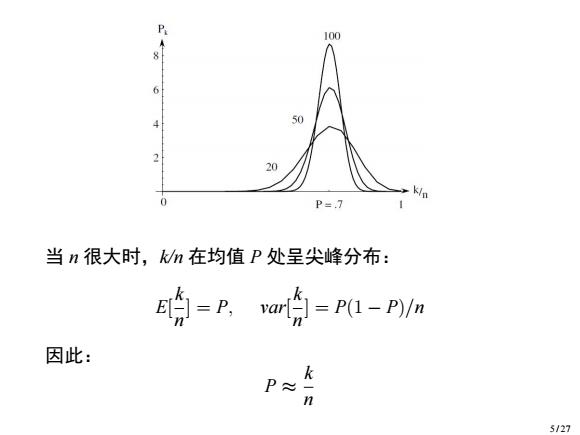
当 n 很大时,k/n 在均值 P 处呈尖峰分布: E[ k n ] = P, var[ k n ] = P(1 − P)/n 因此: P ≈ k n 5 / 27
·如果假定p(x)连续,且区域R足够小,使得p(x)在R这 个区域几乎没有变化,那么我们可以得到如下的一个近似: P=p)≈p) 其中,x是R中的一个点,V是R这个区域的体积(二维情 况下V为面积)。 由P≈k/n,R区域的概率密度函数可以近似估计为: P。k/n 6/27
▶ 如果假定 p(x) 连续,且区域 R 足够小,使得 p(x) 在 R 这 个区域几乎没有变化,那么我们可以得到如下的一个近似: P = ∫ R p(x ′ )dx′ ≈ p(x)V 其中,x 是 R 中的一个点,V 是 R 这个区域的体积(二维情 况下 V 为面积)。 ▶ 由 P ≈ k/n,R 区域的概率密度函数可以近似估计为: p(x) ≈ P V ≈ k/n V 6 / 27
p(x)≈ kn Its validation depends on two contradictory assumptions: o Region R be sufficiently small that the density is approximately constant over the region o Region R be sufficiently large (in relation to the value of that density)that the number k of samples falling inside the region is sufficient for the binomial distribution to be sharply peaked. Condition of converging to the true probability density in the limit n→o, o Ishrinks suitably with n ●k grows with n 7/27
p(x) ≈ k/n V ▶Its validation depends on two contradictory assumptions: Region R be sufficiently small that the density is approximately constant over the region Region R be sufficiently large (in relation to the value of that density) that the number k of samples falling inside the region is sufficient for the binomial distribution to be sharply peaked. ▶ Condition of converging to the true probability density in the limit n → ∞, V shrinks suitably with n k grows with n 7 / 27
k/n p(x)≈ In practice,we will have to find a compromise for V: o Large enough to include enough examples within R o Small enough to support the assumption that is constant within R Two ways to calculate p(x): o fix Iand determine k from the data,giving rise to the kernel approach,such as histogram,Parzen window ofix k and determine /from the data,which gives rise to the k-nearest-neighbor 8/27
p(x) ≃ k/n V ▶ In practice, we will have to find a compromise for V: Large enough to include enough examples within R Small enough to support the assumption that is constant within R ▶ Two ways to calculate p(x): fix V and determine k from the data, giving rise to the kernel approach, such as histogram, Parzen window fix k and determine V from the data, which gives rise to the k-nearest-neighbor 8 / 27
9.2.Histogram Method直方图方法 A very simple method is to partition the space into a number of equally-sized cells(bins) and compute a histogram. Figure 1:Histogram in one dimension. Estimate of the density at a point x becomes k p(x)= WN亚 where N is the total number of samples,k is the number of samples in the cell that includes x,and I is the volume of that cell. 9/27
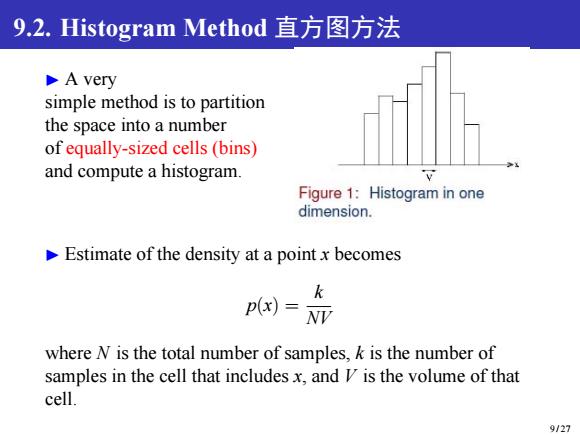
9.2. Histogram Method 直方图方法 ▶ A very simple method is to partition the space into a number of equally-sized cells (bins) and compute a histogram. ▶ Estimate of the density at a point x becomes p(x) = k NV where N is the total number of samples, k is the number of samples in the cell that includes x, and V is the volume of that cell. 9 / 27