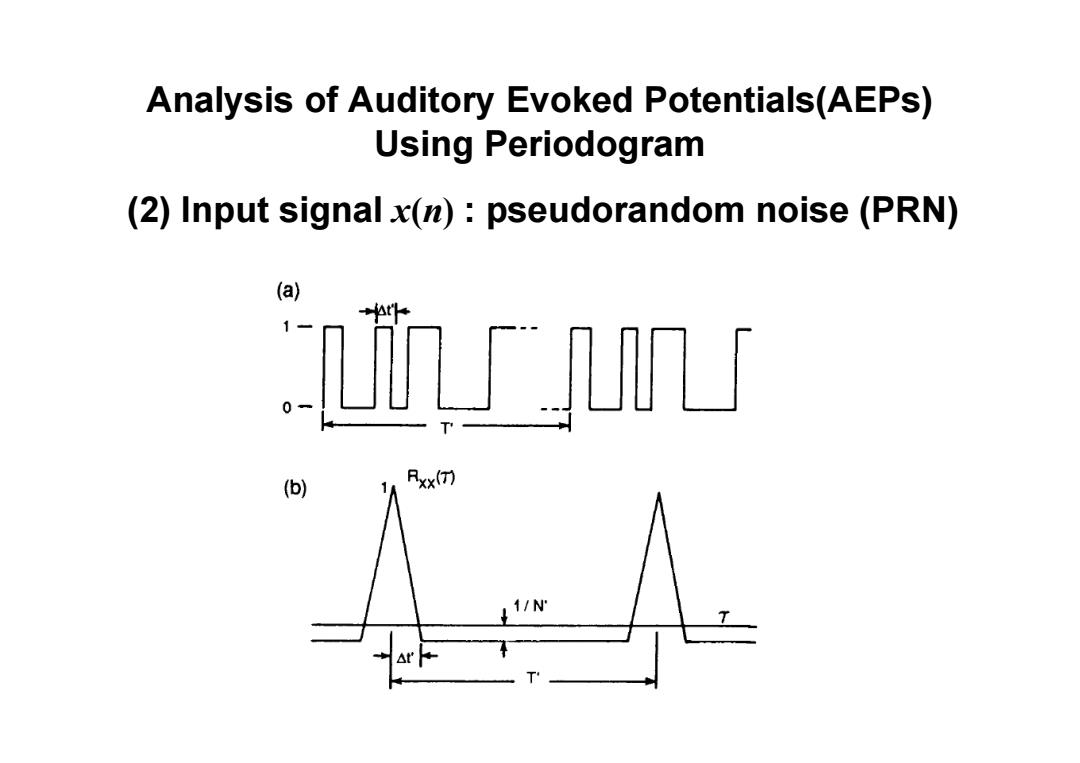
Analysis of Auditory Evoked Potentials(AEPs) Using Periodogram (2)Input signal x(n):pseudorandom noise(PRN) (a) (b) Rxx(T) 11N
Analysis of Auditory Evoked Potentials(AEPs) Using Periodogram (2) Input signal x ( n) : pseudorandom noise (PRN)
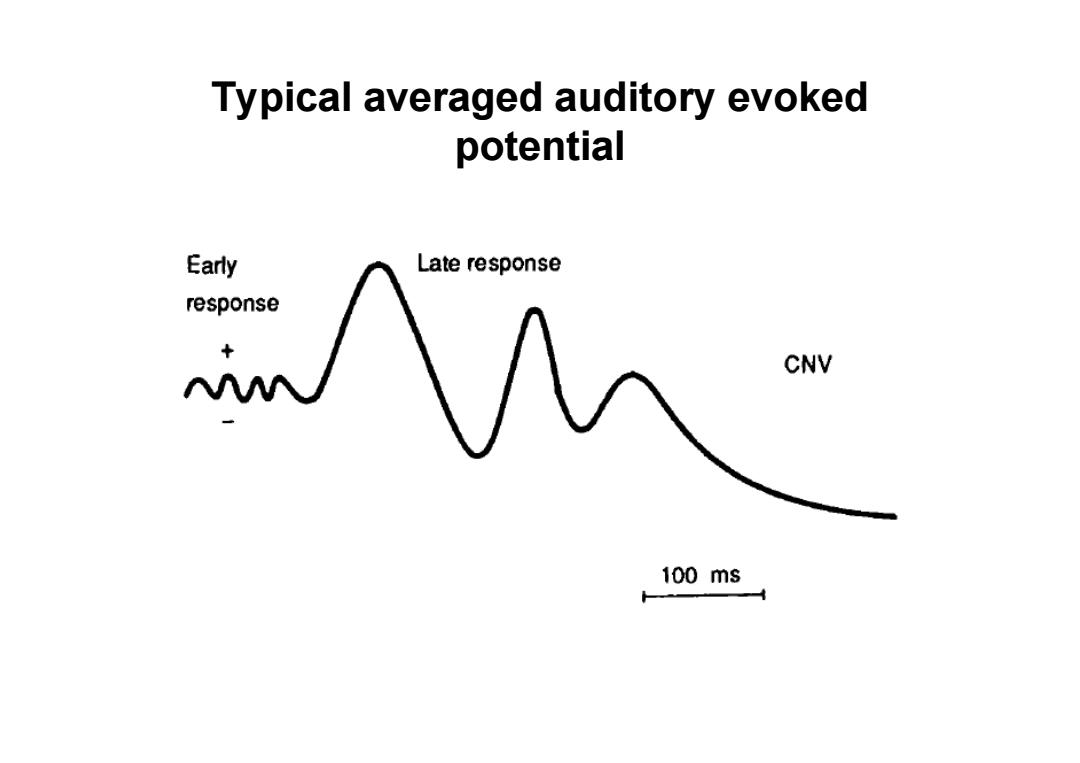
Typical averaged auditory evoked potential Early Late response response CNV 100ms
Typical averaged auditory evoked potential

Analysis of Auditory Evoked Potentials(AEPs) Using Periodogram 3.Subject,Data and Parameters Four normals (MS) Three hearing impsired patients one mildly impaired (JV) one moderately impaired (JV) one with severe hearing loss(FT) The center frequency of the stimulus: (300-4000Hz) A total of 1000AEP responses was averaged for each patient
Analysis of Auditory Evoked Potentials(AEPs) Using Periodogram 3. Subject, Data and Parameters Four normals (MS) Three hearing impsired patients one mildly impaired (JV) one moderately impaired (JV) one with severe hearing loss (FT) The center frequency of the stimulus: (300 – 4000 Hz) A total of 1000AEP responses was averaged for each patient
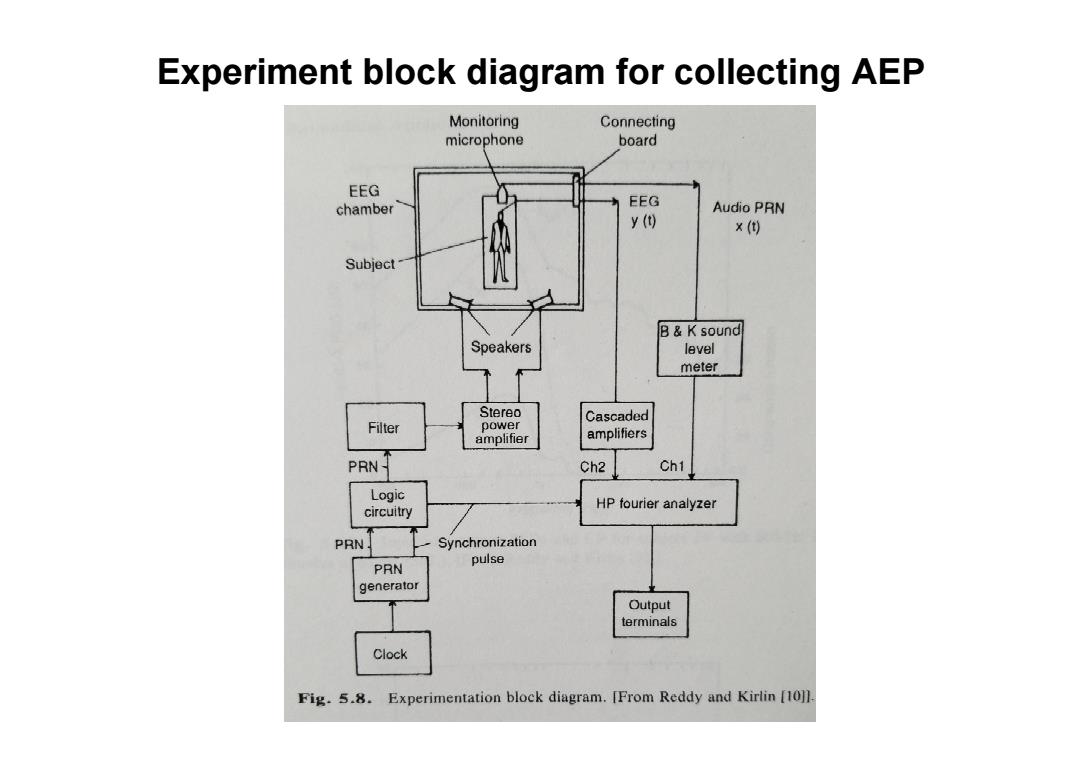
Experiment block diagram for collecting AEP Monitoring Connecting microphone board EEG chamber EEG Audio PRN y() X() Subject B K sound Speakers level meter Stereo Cascaded Filter power amplifier amplifiers PRN- Ch2 Ch1 Logic circuitry HP fourier analyzer PRN. Synchronization PRN pulse generator Output terminals Clock Fig.5.8.Experimentation block diagram.[From Reddy and Kirlin [10]]
Experiment block diagram for collecting AEP

4a一 wfg (b) Fig..9.(a)NB burst stimulus at 600 Hz and(b)its averaged AEP for subject MS.[From Reddy and Kirlin [10]]