Partial autocorrelation test This test is similar to the autocorrelation test.Given the residual process x(n),it can be shown that when N is sufficiently large,the partial autocorrelation sequence(PACS)values {k}for lag /are approximately independent with distribution.This means that roughly 95 percent of the PACS values fall within the bounds±1.96/√N(本来应该所有点都在里面,还是由于有限长数据 的随机性导致)If we observe values consistently well beyond this range for N sufficiently large,it may indicate nonwhiteness of the signal
This test is similar to the autocorrelation test. Given the residual process x(n), it can be shown that when N is sufficiently large, the partial autocorrelation sequence (PACS) values {kl } for lag l are approximately independent with distribution. This means that roughly 95 percent of the PACS values fall within the bounds (本来应该所有点都在里面,还是由于有限长数据 的随机性导致) If we observe values consistently well beyond this range for N sufficiently large, it may indicate nonwhiteness of the signal. 1 96 N Partial autocorrelation test

Model validation 上述三种检测均为检测残差信号的某种序列是否会超过一 定的上下界,若各点均在上下界内,则残差信号是具有白色性, 说明估计模型是合适的;反之,若超出界限,则残差信号是非 白色的
上述三种检测均为检测残差信号的某种序列是否会超过一 定的上下界,若各点均在上下界内,则残差信号是具有白色性, 说明估计模型是合适的;反之,若超出界限,则残差信号是非 白色的。 Model validation
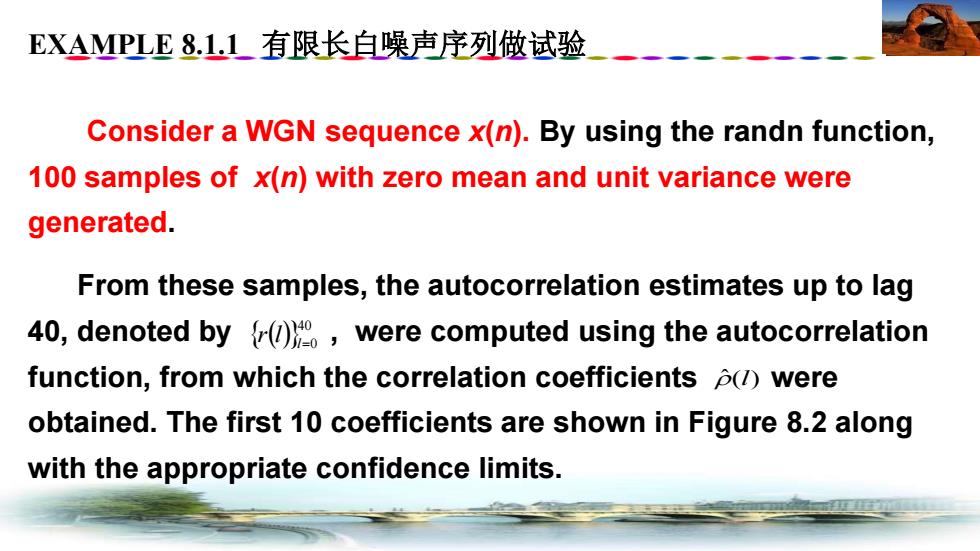
EXAMPLE8L.1有限长白噪声序列做试验 Consider a WGN sequence x(n).By using the randn function, 100 samples of x(n)with zero mean and unit variance were generated. From these samples,the autocorrelation estimates up to lag 40,denoted by (were computed using the autocorrelation function,from which the correlation coefficients (were obtained.The first 10 coefficients are shown in Figure 8.2 along with the appropriate confidence limits
Consider a WGN sequence x(n). By using the randn function, 100 samples of x(n) with zero mean and unit variance were generated. From these samples, the autocorrelation estimates up to lag 40, denoted by , were computed using the autocorrelation function, from which the correlation coefficients were obtained. The first 10 coefficients are shown in Figure 8.2 along with the appropriate confidence limits. ˆ( )l EXAMPLE 8.1.1 有限长白噪声序列做试验 ( ) 40 l=0 r l

Example 8.1.1 WGN samples Autocorrelation test 4 32 1.00 1 2 lhwW小%r 0.17 20 40 60 80 100 5 10 内 Lag PSD test Partial autocorrelation test 1.00 1.00 三 墨 0.17 .17 0 -0.17 .17 0.10.20.30.4 0.5 0 5 10 Frequency (cycles/samp) Lag/ FIGURE 8.2 Validation tests on white Gaussian noise 20
20 FIGURE 8.2 Validation tests on white Gaussian noise Example 8.1.1
8.2 Estimation of All-Pole Models 8.2.1 Direct Structures 8.2.2 Lattice Structures 8.2.3 Maximum Entropy Method 8.2.4 Excitations with Line Spectra 21
21 8.2 Estimation of All-Pole Models 8.2.1 Direct Structures 8.2.2 Lattice Structures 8.2.3 Maximum Entropy Method 8.2.4 Excitations with Line Spectra