
20 Length/height-for-age,boys 0u4 S 年丹 S 日 季 三 e 三 S00 S 吕 98 等 守 S.06 紧 s ou 9 3 听 g 品 9'9L 蒙 默 s 00100 g 子 690 后 三 祭 琴 3 吉 于 三 ξ 学 0.66 C36 00031 ¥ 2 三 56 L66 ow t 2 S 子 房 三 S.05 足 景 惑 罗 8.76 0091 e 导 9 三 0.05 g.25 G06 696 S.46 8 品 g 220 080 景 罗 罗 000g1 S 导 g 日 李 芝 感 三 0u2 g 导 6 6 居 Z'bS 楚 6006 9.CM0 0121 g 8 其 学 g.06 t'96 066 pit 导 9'b 5C5 0160 S·6S 投 0011 S 于 8 g19 2.16 云 号 手 兰 9t 8IS 云 云 0.10 0001 9 L01 0242 005 t68 紧 896 S36 241 g 8 志 S s'st I'sS 冠 器 006 装 00u6 2 米 9 笪 e g 袋 0.86 网 三 5 孕 云 度 女:66 0U0 8 g 尉 泾 层 景 g 60 9 9 品 e g 5 的
Table 13 Observed proportions of children with measurements below the fitted centiles from Model 1, length/height-for-age for boys Expected Birth 14 d 28 d 42 d 2 mo 3 mo 4 mo 5 mo 6 mo 7 mo 1 0.7 0.5 0.7 1.2 0.2 1.2 1.0 0.5 0.5 0.7 3 2.0 2.9 3.0 2.6 4.0 2.9 2.6 2.4 3.1 4.6 5 5.2 6.4 4.4 4.0 5.7 5.0 4.1 4.1 5.5 5.6 10 11.1 11.7 10.3 9.0 9.7 9.3 8.2 10.1 8.6 10.7 25 25.5 25.5 24.6 24.6 24.1 22.9 24.5 24.3 24.6 22.6 50 48.9 55.1 51.8 52.7 54.2 51.9 50.5 49.5 50.6 49.4 75 74.4 74.5 74.0 74.0 76.2 75.0 74.0 75.0 76.6 78.6 90 88.0 88.8 91.1 89.8 89.2 90.2 90.6 89.7 90.7 91.2 95 94.8 95.0 95.1 94.8 94.8 95.2 94.2 94.0 94.7 94.2 97 97.4 96.9 97.0 96.5 96.9 96.7 95.7 95.0 97.1 96.1 99 99.4 98.3 98.8 98.8 98.6 98.6 97.8 98.3 98.8 98.8 Expected 8 mo 9 mo 10 mo 11 mo 12 mo 14 mo 16 mo 18 mo 20 mo 22 mo 1 0.9 1.0 1.5 1.7 1.2 1.7 1.2 1.4 1.2 0.7 3 4.7 3.8 3.7 3.2 3.4 4.0 4.6 3.2 3.1 2.6 5 6.4 5.8 5.7 4.7 6.0 5.5 5.8 4.3 4.8 3.6 10 10.6 10.3 10.1 9.0 9.4 10.2 11.1 7.0 10.4 9.3 25 22.4 23.1 24.0 23.9 24.7 23.5 25.5 24.1 26.9 22.8 50 52.1 50.8 49.9 50.8 49.6 49.4 50.0 50.7 51.1 49.2 75 75.5 77.9 72.6 72.0 75.3 72.9 75.2 73.9 75.6 74.5 90 91.0 91.2 89.4 91.4 90.6 89.3 92.5 92.1 90.8 90.5 95 96.0 95.7 95.8 95.1 96.4 94.1 95.9 95.5 95.6 95.3 97 97.2 96.2 96.8 97.2 97.6 97.9 96.9 97.5 97.3 97.1 99 99.1 98.0 98.8 98.9 99.0 99.5 98.6 99.1 99.2 99.6 20 Length/height-for-age, boys
Length/height-for-age,boys 21 IIB.I3AO 2 月 000 三 食 867 景 景 G.30 0002 B 志 8 系 E 8 0.86 0.001 011k9 二 5 厨 2.k0 996 b.66 ow gs 兰 三 然 ·16 006 A66 9 三 3 学 会 三 导 A.66 ou 9t S 上 9 8 月 s 700 0000 二 于 S 焉 多 性 110 00y 3 的 女00 苦 L'OS 三 2h6 孕 010 0192 吉 ¥ 登 512 材G9 086 S00 S30 01h2 导 丹 兰 200 n g 品 g g 6
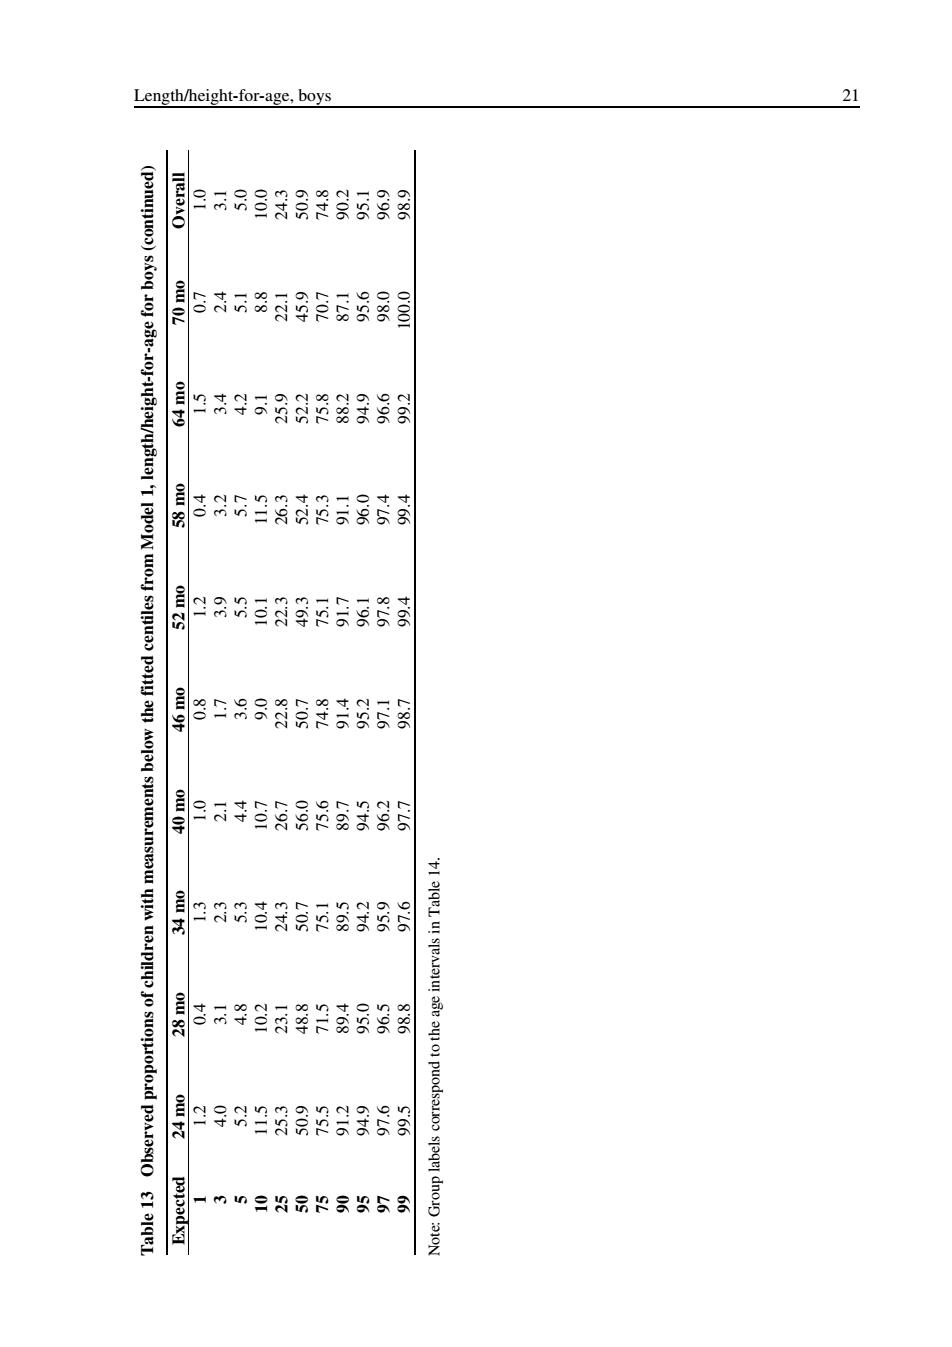
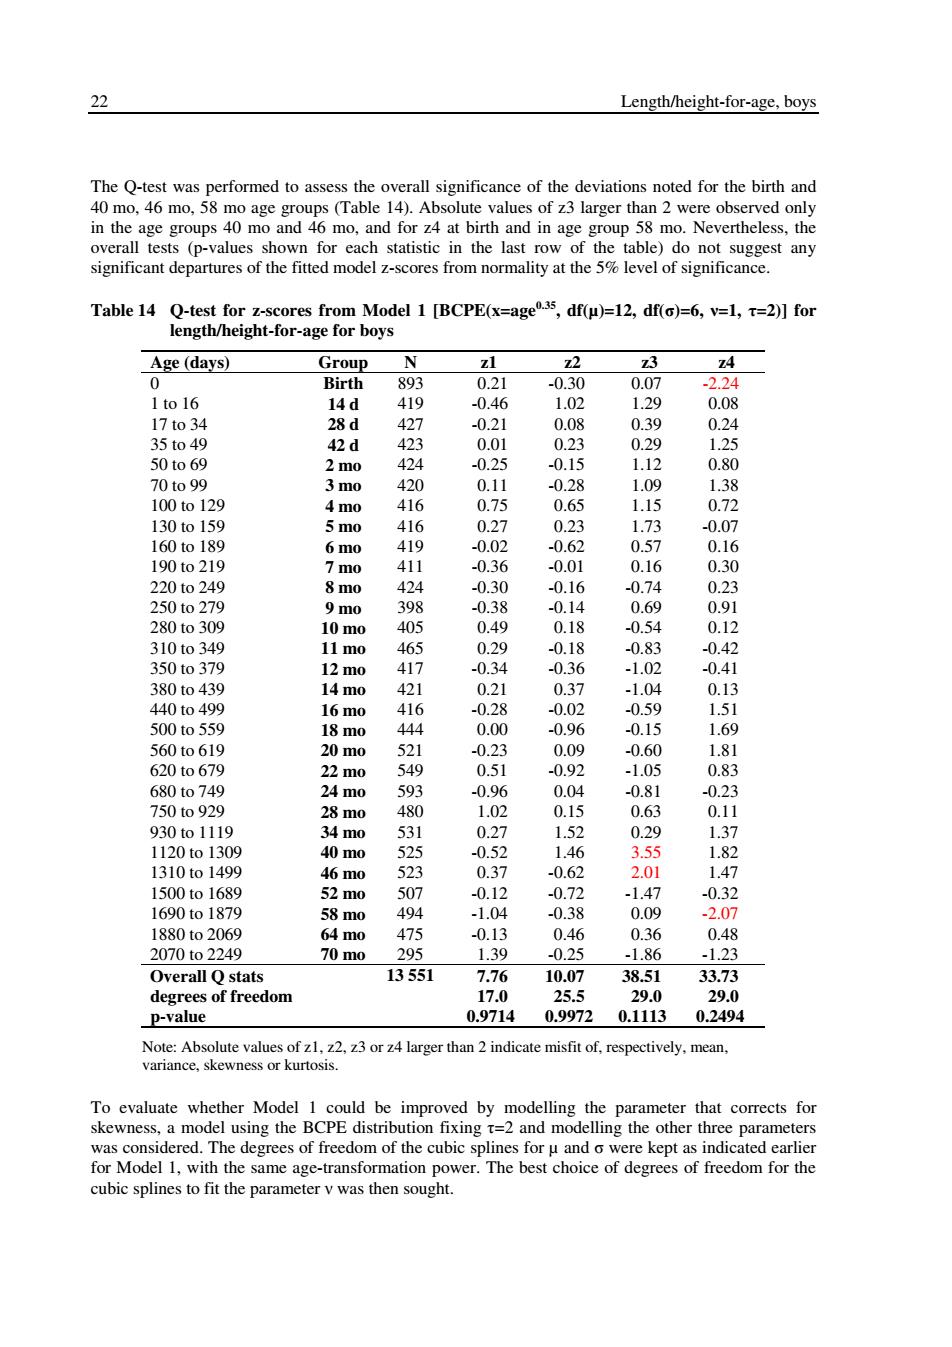
Table 13 Observed proportions of children with measurements below the fitted centiles from Model 1, length/height-for-age for boys (continued) Expected 24 mo 28 mo 34 mo 40 mo 46 mo 52 mo 58 mo 64 mo 70 mo Overall 1 1.2 0.4 1.3 1.0 0.8 1.2 0.4 1.5 0.7 1.0 3 4.0 3.1 2.3 2.1 1.7 3.9 3.2 3.4 2.4 3.1 5 5.2 4.8 5.3 4.4 3.6 5.5 5.7 4.2 5.1 5.0 10 11.5 10.2 10.4 10.7 9.0 10.1 11.5 9.1 8.8 10.0 25 25.3 23.1 24.3 26.7 22.8 22.3 26.3 25.9 22.1 24.3 50 50.9 48.8 50.7 56.0 50.7 49.3 52.4 52.2 45.9 50.9 75 75.5 71.5 75.1 75.6 74.8 75.1 75.3 75.8 70.7 74.8 90 91.2 89.4 89.5 89.7 91.4 91.7 91.1 88.2 87.1 90.2 95 94.9 95.0 94.2 94.5 95.2 96.1 96.0 94.9 95.6 95.1 97 97.6 96.5 95.9 96.2 97.1 97.8 97.4 96.6 98.0 96.9 99 99.5 98.8 97.6 97.7 98.7 99.4 99.4 99.2 100.0 98.9 Note: Group labels correspond to the age intervals in Table 14. Length/height-for-age, boys 21
22 Length/height-for-age,boys The Q-test was performed to assess the overall significance of the deviations noted for the birth and 40 mo,46 mo,58 mo age groups (Table 14).Absolute values of z3 larger than 2 were observed only in the age groups 40 mo and 46 mo,and for z4 at birth and in age group 58 mo.Nevertheless,the overall tests (p-values shown for each statistic in the last row of the table)do not suggest any significant departures of the fitted model z-scores from normality at the 5%level of significance. Table 14 Q-test for z-scores from Model 1 [BCPE(x=age3,df(u)=12,df()=6,v=1,=2)]for length/height-for-age for boys Age(days) Group N zl 22 Z3 Z4 0 Birth 893 0.21 -0.30 0.07 -2.24 1to16 14d 419 -0.46 1.02 1.29 0.08 17to34 28d 427 -0.21 0.08 0.39 0.24 35to49 42d 423 0.01 0.23 0.29 1.25 50to69 2 mo 424 -0.25 -0.15 1.12 0.80 70to99 3mo 420 0.11 -0.28 1.09 1.38 100to129 4 mo 416 0.75 0.65 1.15 0.72 130to159 5mo 416 0.27 0.23 1.73 -0.07 160to189 6mo 419 -0.02 -0.62 0.57 0.16 190to219 7mo 411 -0.36 -0.01 0.16 0.30 220to249 8mo 424 -0.30 -0.16 -0.74 0.23 250to279 9 mo 398 -0.38 -0.14 0.69 0.91 280to309 10 mo 405 0.49 0.18 -0.54 0.12 310to349 11mo 465 0.29 -0.18 -0.83 -0.42 350to379 12m0 417 -0.34 -0.36 -1.02 -0.41 380to439 14 mo 421 0.21 0.37 -1.04 0.13 440to499 16m0 416 -0.28 -0.02 -0.59 1.51 500to559 18 mo 444 0.00 -0.96 -0.15 1.69 560to619 20 mo 521 -0.23 0.09 -0.60 1.81 620to679 22 mo 549 0.51 -0.92 -1.05 0.83 680to749 24m0 593 -0.96 0.04 -0.81 -0.23 750to929 28 mo 480 1.02 0.15 0.63 0.11 930to1119 34 mo 531 0.27 1.52 0.29 1.37 1120to1309 40 mo 525 -0.52 1.46 3.55 1.82 1310to1499 46m0 523 0.37 -0.62 2.01 1.47 1500to1689 52 mo 507 -0.12 -0.72 -1.47 -0.32 1690to1879 58 mo 494 -1.04 -0.38 0.09 -2.07 1880to2069 64 mo 475 -0.13 0.46 0.36 0.48 2070to2249 70m0 295 1.39 -0.25 -1.86 -1.23 Overall Q stats 13551 7.76 10.07 38.51 33.73 degrees of freedom 17.0 25.5 29.0 29.0 p-value 0.9714 0.9972 0.1113 0.2494 Note:Absolute values of z1,z2,z3 or z4 larger than 2 indicate misfit of,respectively,mean, variance,skewness or kurtosis. To evaluate whether Model 1 could be improved by modelling the parameter that corrects for skewness,a model using the BCPE distribution fixing t=2 and modelling the other three parameters was considered.The degrees of freedom of the cubic splines for u and o were kept as indicated earlier for Model 1,with the same age-transformation power.The best choice of degrees of freedom for the cubic splines to fit the parameter v was then sought
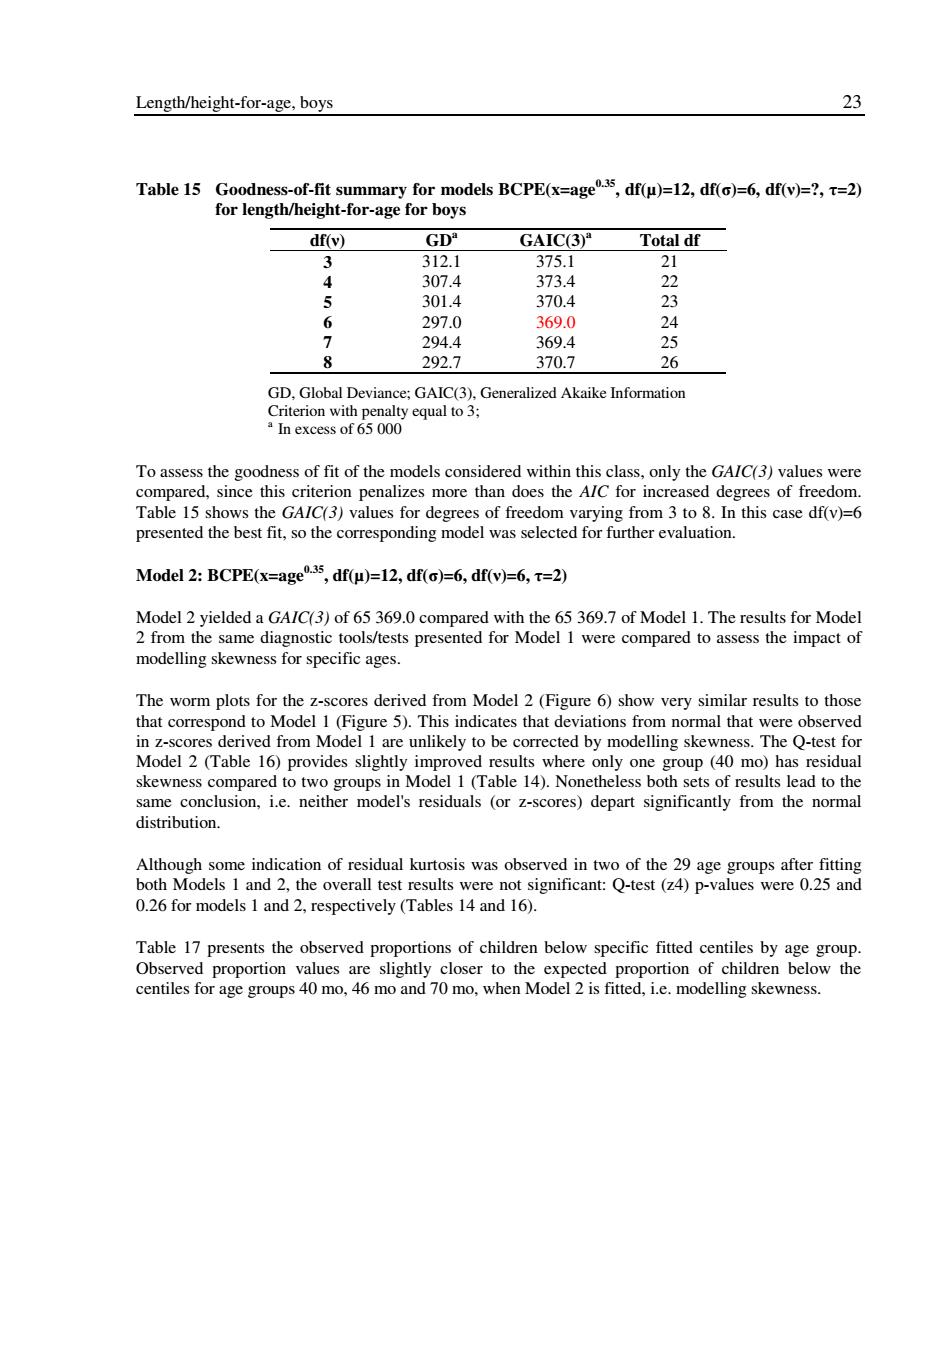
22 Length/height-for-age, boys The Q-test was performed to assess the overall significance of the deviations noted for the birth and 40 mo, 46 mo, 58 mo age groups (Table 14). Absolute values of z3 larger than 2 were observed only in the age groups 40 mo and 46 mo, and for z4 at birth and in age group 58 mo. Nevertheless, the overall tests (p-values shown for each statistic in the last row of the table) do not suggest any significant departures of the fitted model z-scores from normality at the 5% level of significance. Table 14 Q-test for z-scores from Model 1 [BCPE(x=age0.35, df(µ)=12, df(σ)=6, ν=1, τ=2)] for length/height-for-age for boys Age (days) Group N z1 z2 z3 z4 0 Birth 893 0.21 -0.30 0.07 -2.24 1 to 16 14 d 419 -0.46 1.02 1.29 0.08 17 to 34 28 d 427 -0.21 0.08 0.39 0.24 35 to 49 42 d 423 0.01 0.23 0.29 1.25 50 to 69 2 mo 424 -0.25 -0.15 1.12 0.80 70 to 99 3 mo 420 0.11 -0.28 1.09 1.38 100 to 129 4 mo 416 0.75 0.65 1.15 0.72 130 to 159 5 mo 416 0.27 0.23 1.73 -0.07 160 to 189 6 mo 419 -0.02 -0.62 0.57 0.16 190 to 219 7 mo 411 -0.36 -0.01 0.16 0.30 220 to 249 8 mo 424 -0.30 -0.16 -0.74 0.23 250 to 279 9 mo 398 -0.38 -0.14 0.69 0.91 280 to 309 10 mo 405 0.49 0.18 -0.54 0.12 310 to 349 11 mo 465 0.29 -0.18 -0.83 -0.42 350 to 379 12 mo 417 -0.34 -0.36 -1.02 -0.41 380 to 439 14 mo 421 0.21 0.37 -1.04 0.13 440 to 499 16 mo 416 -0.28 -0.02 -0.59 1.51 500 to 559 18 mo 444 0.00 -0.96 -0.15 1.69 560 to 619 20 mo 521 -0.23 0.09 -0.60 1.81 620 to 679 22 mo 549 0.51 -0.92 -1.05 0.83 680 to 749 24 mo 593 -0.96 0.04 -0.81 -0.23 750 to 929 28 mo 480 1.02 0.15 0.63 0.11 930 to 1119 34 mo 531 0.27 1.52 0.29 1.37 1120 to 1309 40 mo 525 -0.52 1.46 3.55 1.82 1310 to 1499 46 mo 523 0.37 -0.62 2.01 1.47 1500 to 1689 52 mo 507 -0.12 -0.72 -1.47 -0.32 1690 to 1879 58 mo 494 -1.04 -0.38 0.09 -2.07 1880 to 2069 64 mo 475 -0.13 0.46 0.36 0.48 2070 to 2249 70 mo 295 1.39 -0.25 -1.86 -1.23 Overall Q stats 13 551 7.76 10.07 38.51 33.73 degrees of freedom 17.0 25.5 29.0 29.0 p-value 0.9714 0.9972 0.1113 0.2494 Note: Absolute values of z1, z2, z3 or z4 larger than 2 indicate misfit of, respectively, mean, variance, skewness or kurtosis. To evaluate whether Model 1 could be improved by modelling the parameter that corrects for skewness, a model using the BCPE distribution fixing τ=2 and modelling the other three parameters was considered. The degrees of freedom of the cubic splines for µ and σ were kept as indicated earlier for Model 1, with the same age-transformation power. The best choice of degrees of freedom for the cubic splines to fit the parameter ν was then sought
Length/height-for-age,boys 23 Table 15 Goodness-of-fit summary for models BCPE(x=age35,df(u)=12,df()=6,df(v)=?,r=2) for length/height-for-age for boys df(v) GD" GAIC(3) Total df 3 312.1 375.1 21 4 307.4 373.4 22 5 301.4 370.4 23 6 297.0 369.0 24 7 294.4 369.4 25 8 292.7 370.7 26 GD.Global Deviance:GAIC(3).Generalized Akaike Information Criterion with penalty equal to 3; In excess of 65 000 To assess the goodness of fit of the models considered within this class,only the GA/C(3)values were compared,since this criterion penalizes more than does the AlC for increased degrees of freedom. Table 15 shows the GAIC(3)values for degrees of freedom varying from 3 to 8.In this case df(v)=6 presented the best fit,so the corresponding model was selected for further evaluation. Model 2:BCPE(x=age35,df(u)=12,df(o)=6,df(v)=6,T=2) Model 2 yielded a GAIC(3)of 65 369.0 compared with the 65 369.7 of Model 1.The results for Model 2 from the same diagnostic tools/tests presented for Model 1 were compared to assess the impact of modelling skewness for specific ages. The worm plots for the z-scores derived from Model 2(Figure 6)show very similar results to those that correspond to Model 1(Figure 5).This indicates that deviations from normal that were observed in z-scores derived from Model 1 are unlikely to be corrected by modelling skewness.The Q-test for Model 2 (Table 16)provides slightly improved results where only one group (40 mo)has residual skewness compared to two groups in Model 1 (Table 14).Nonetheless both sets of results lead to the same conclusion,i.e.neither model's residuals (or z-scores)depart significantly from the normal distribution. Although some indication of residual kurtosis was observed in two of the 29 age groups after fitting both Models 1 and 2,the overall test results were not significant:Q-test(z4)p-values were 0.25 and 0.26 for models 1 and 2,respectively(Tables 14 and 16). Table 17 presents the observed proportions of children below specific fitted centiles by age group. Observed proportion values are slightly closer to the expected proportion of children below the centiles for age groups 40 mo,46 mo and 70 mo,when Model 2 is fitted,i.e.modelling skewness
Length/height-for-age, boys 23 Table 15 Goodness-of-fit summary for models BCPE(x=age0.35, df(µ)=12, df(σ)=6, df(ν)=?, τ=2) for length/height-for-age for boys df(ν) GDa GAIC(3)a Total df 3 312.1 375.1 21 4 307.4 373.4 22 5 301.4 370.4 23 6 297.0 369.0 24 7 294.4 369.4 25 8 292.7 370.7 26 GD, Global Deviance; GAIC(3), Generalized Akaike Information Criterion with penalty equal to 3; a In excess of 65 000 To assess the goodness of fit of the models considered within this class, only the GAIC(3) values were compared, since this criterion penalizes more than does the AIC for increased degrees of freedom. Table 15 shows the GAIC(3) values for degrees of freedom varying from 3 to 8. In this case df(ν)=6 presented the best fit, so the corresponding model was selected for further evaluation. Model 2: BCPE(x=age0.35, df(µ)=12, df(σ)=6, df(ν)=6, τ=2) Model 2 yielded a GAIC(3) of 65 369.0 compared with the 65 369.7 of Model 1. The results for Model 2 from the same diagnostic tools/tests presented for Model 1 were compared to assess the impact of modelling skewness for specific ages. The worm plots for the z-scores derived from Model 2 (Figure 6) show very similar results to those that correspond to Model 1 (Figure 5). This indicates that deviations from normal that were observed in z-scores derived from Model 1 are unlikely to be corrected by modelling skewness. The Q-test for Model 2 (Table 16) provides slightly improved results where only one group (40 mo) has residual skewness compared to two groups in Model 1 (Table 14). Nonetheless both sets of results lead to the same conclusion, i.e. neither model's residuals (or z-scores) depart significantly from the normal distribution. Although some indication of residual kurtosis was observed in two of the 29 age groups after fitting both Models 1 and 2, the overall test results were not significant: Q-test (z4) p-values were 0.25 and 0.26 for models 1 and 2, respectively (Tables 14 and 16). Table 17 presents the observed proportions of children below specific fitted centiles by age group. Observed proportion values are slightly closer to the expected proportion of children below the centiles for age groups 40 mo, 46 mo and 70 mo, when Model 2 is fitted, i.e. modelling skewness
24 Length/height-for-age,boys .123 46m0 52m0 58m0 64m0 24m0 28:mo 40mo号 0 10 mo 、11n0 、12mo .14m0 16m0 18 mo no 9 mo 28 3m0 3 123 3 1123 -3-1 -123 Unit normal quantile Figure 6 Worm plots of z-scores for Model 2 for length/height-for-age for boys The diagnostic tools/tests used to evaluate distinct models supported the selection of the simplest model,i.e.the BCPE distribution with fixed v=1 and t=2,that corresponds to the normal distribution. Overall statistics like GAIC(3)supported this choice.Considering local goodness of fit,the Q-test indicated minor departures from normality as reflected by the residuals (z-scores)of very few age groups when Model 1 was fitted.The worm plot results similarly indicate misfits for very few age groups.Since those isolated discrepancies or misfits were only partially corrected by modelling the parameter v of the distribution(Model 2),it is reasonable to assume that these deviations occurred by chance or for other than biological reasons,and that the simpler model (i.e.Model 1)is adequate. Model 1 was selected and a new iteration was done using the values of df(u)and df(o)equal to 12 and 6,respectively,to re-search the best age-transformation power A.The smallest global deviance in this case was for A=0.4 (GD=65 315.6),but with only a very minor difference from the model using A=0.35 (GD=65 315.7).There was thus no need for updating and the selected model for constructing the length/height-for-age growth curves for boys remained BCPE(x=age35,df(u)=12. df(o)=6,v=1,t=2)
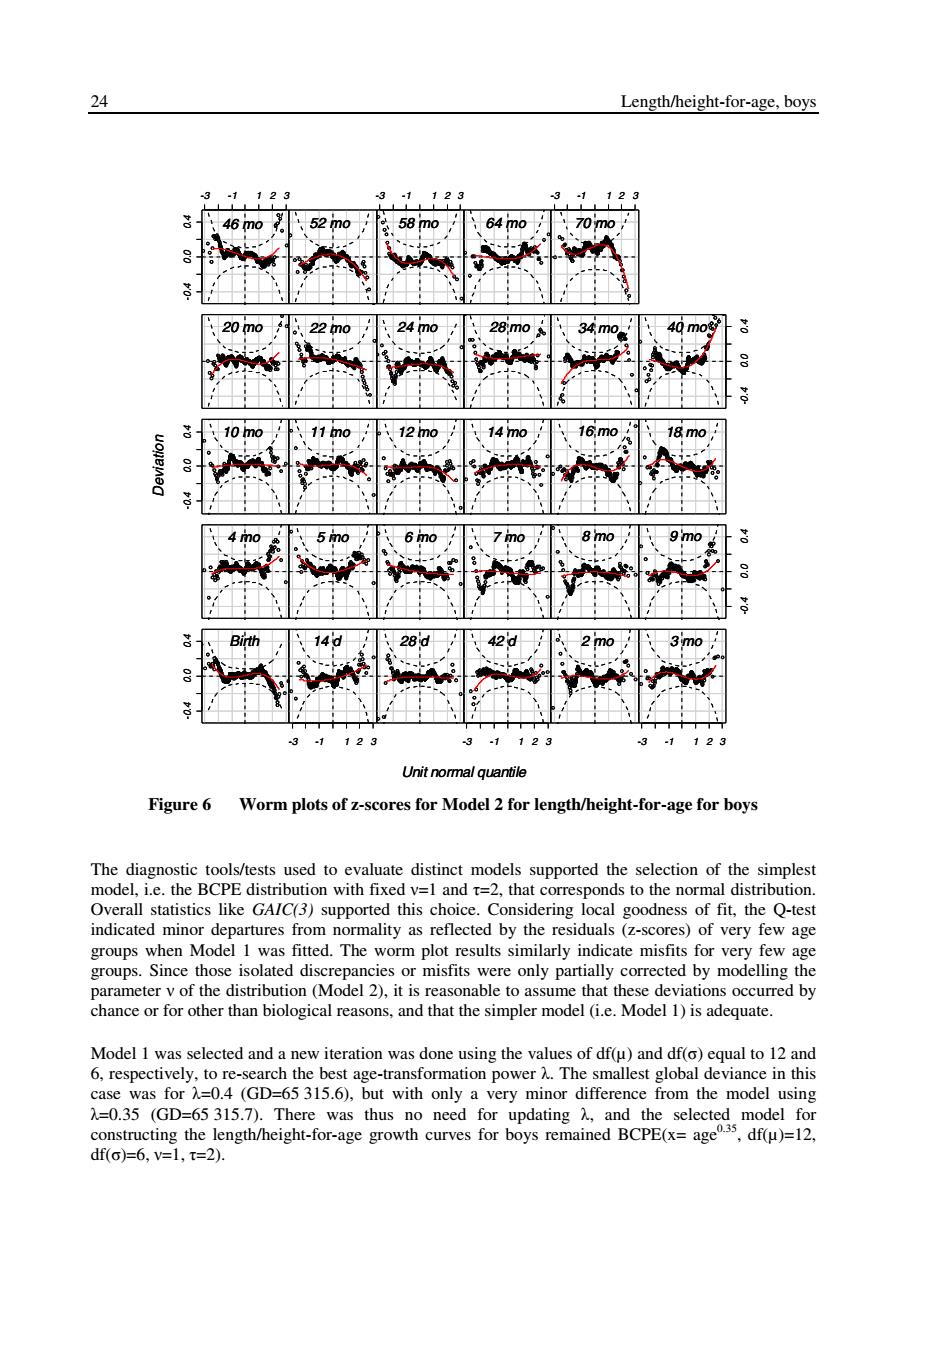
24 Length/height-for-age, boys -0.4 0.0 0.4 -3 -1 1 2 3 -3 -1 1 2 3 -3 -1 1 2 3 -0.4 0.0 0.4 -0.4 0.0 0.4 -0.4 0.0 0.4 -3 -1 1 2 3 -0.4 0.0 0.4 -3 -1 1 2 3 -3 -1 1 2 3 Unit normal quantile Deviation Birth 14 d 28 d 42 d 2 mo 3 mo 4 mo 5 mo 6 mo 7 mo 8 mo 9 mo 10 mo 11 mo 12 mo 14 mo 16 mo 18 mo 20 mo 22 mo 24 mo 28 mo 34 mo 40 mo 46 mo 52 mo 58 mo 64 mo 70 mo -0.4 0.0 0.4 -3 -1 1 2 3 -3 -1 1 2 3 -3 -1 1 2 3 -0.4 0.0 0.4 -0.4 0.0 0.4 -0.4 0.0 0.4 -3 -1 1 2 3 -0.4 0.0 0.4 -3 -1 1 2 3 -3 -1 1 2 3 Unit normal quantile Deviation Birth 14 d 28 d 42 d 2 mo 3 mo 4 mo 5 mo 6 mo 7 mo 8 mo 9 mo 10 mo 11 mo 12 mo 14 mo 16 mo 18 mo 20 mo 22 mo 24 mo 28 mo 34 mo 40 mo 46 mo 52 mo 58 mo 64 mo 70 mo Birth 14 d 28 d 42 d 2 mo 3 mo 4 mo 5 mo 6 mo 7 mo 8 mo 9 mo 10 mo 11 mo 12 mo 14 mo 16 mo 18 mo 20 mo 22 mo 24 mo 28 mo 34 mo 40 mo 46 mo 52 mo 58 mo 64 mo 70 mo Figure 6 Worm plots of z-scores for Model 2 for length/height-for-age for boys The diagnostic tools/tests used to evaluate distinct models supported the selection of the simplest model, i.e. the BCPE distribution with fixed ν=1 and τ=2, that corresponds to the normal distribution. Overall statistics like GAIC(3) supported this choice. Considering local goodness of fit, the Q-test indicated minor departures from normality as reflected by the residuals (z-scores) of very few age groups when Model 1 was fitted. The worm plot results similarly indicate misfits for very few age groups. Since those isolated discrepancies or misfits were only partially corrected by modelling the parameter ν of the distribution (Model 2), it is reasonable to assume that these deviations occurred by chance or for other than biological reasons, and that the simpler model (i.e. Model 1) is adequate. Model 1 was selected and a new iteration was done using the values of df(µ) and df(σ) equal to 12 and 6, respectively, to re-search the best age-transformation power λ. The smallest global deviance in this case was for λ=0.4 (GD=65 315.6), but with only a very minor difference from the model using λ=0.35 (GD=65 315.7). There was thus no need for updating λ, and the selected model for constructing the length/height-for-age growth curves for boys remained BCPE(x= age0.35, df(µ)=12, df(σ)=6, ν=1, τ=2)