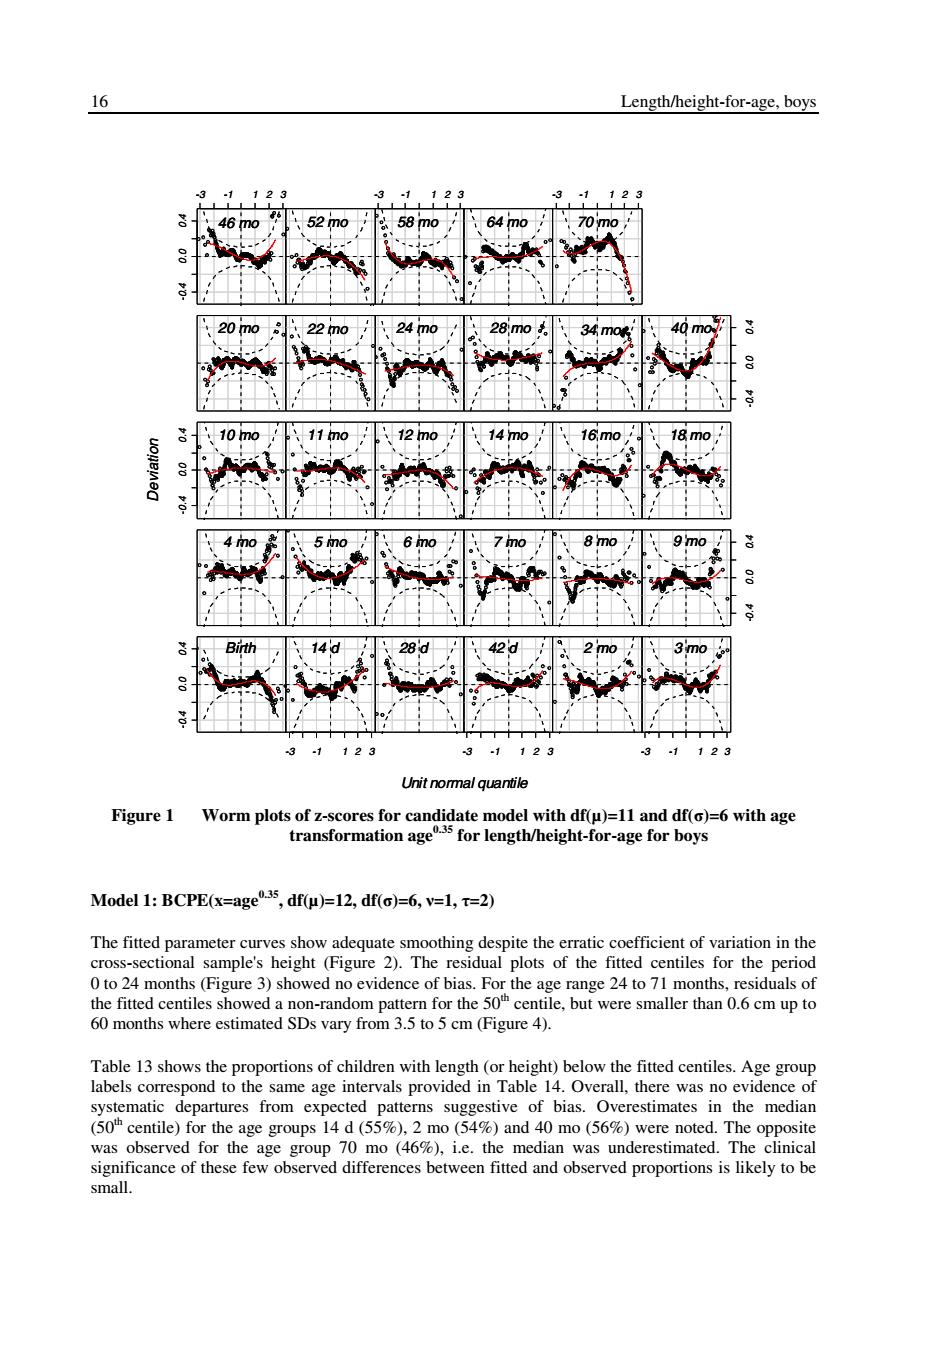
Length/height-for-age,boys 15 Table 12 Goodness-of-fit summary for models using the BCPE distribution with fixed v=1 and t=2 for length/height-for-age for boys dfμ)df(o) GD AICa GAIC(3)"Total df 4 338.5 364.5 377.5 13 5 330.1 358.1 372.1 14 9 6 326.5 356.5 371.5 5 7 324.5 356.6 372.6 16 8 323.1 357.1 374.1 17 Y 332.9 360.9 374.9 4 5 324.5 354.5 369.5 15 10 6 320.8 352.8 368.8 16 7 318.9 352.9 369.9 17 8 317.5 353.5 371.5 18 4 329.8 359.8 374.8 15 321.4 353.4 369.4 16 11 6 317.7 351.7 368.7 17 7 315.8 351.8 369.8 18 8 314.4 352.4 371.4 19 4 327.8 359.8 375.8 16 5 319.4 353.4 370.4 17 12 6 315.7 351.7 369.7 18 7 313.8 351.8 370.8 19 8 312.4 352.4 372.4 20 4 326.4 360.4 377.4 17 317.9 353.9 371.9 18 13 6 314.2 352.2 371.2 19 312.3 352.3 372.3 20 8 311.0 353.0 374.0 21 GD,Global Deviance;AIC,Akaike Information Criterion; GAIC(3),Generalized AIC with penalty equal to 3; a In excess of 65 000. The best combination of AlC and GA/C(3)corresponds to df(u)=11 or 12 and df(o)=6.To select between df(u)=11 and 12,their respective worm plots (Figures 1 and 5)were compared.Age group labels in the worm plots correspond to those shown in Table 14.The model df(u)=11 presents evidence of misfit in the median curve for a few age groups (e.g.14 d,4 mo)for which corresponding plots have worms shifted down or up(Figure 1).The fit was improved by increasing the df(u)to 12 (Figure 5),and thus the combination of df(u)=12 and df(o)=6 was chosen.Further evaluations of this model were carried out by examining the fit of the u and o curves and the patterns of the centile residuals(the empirical minus the fitted centiles)across age
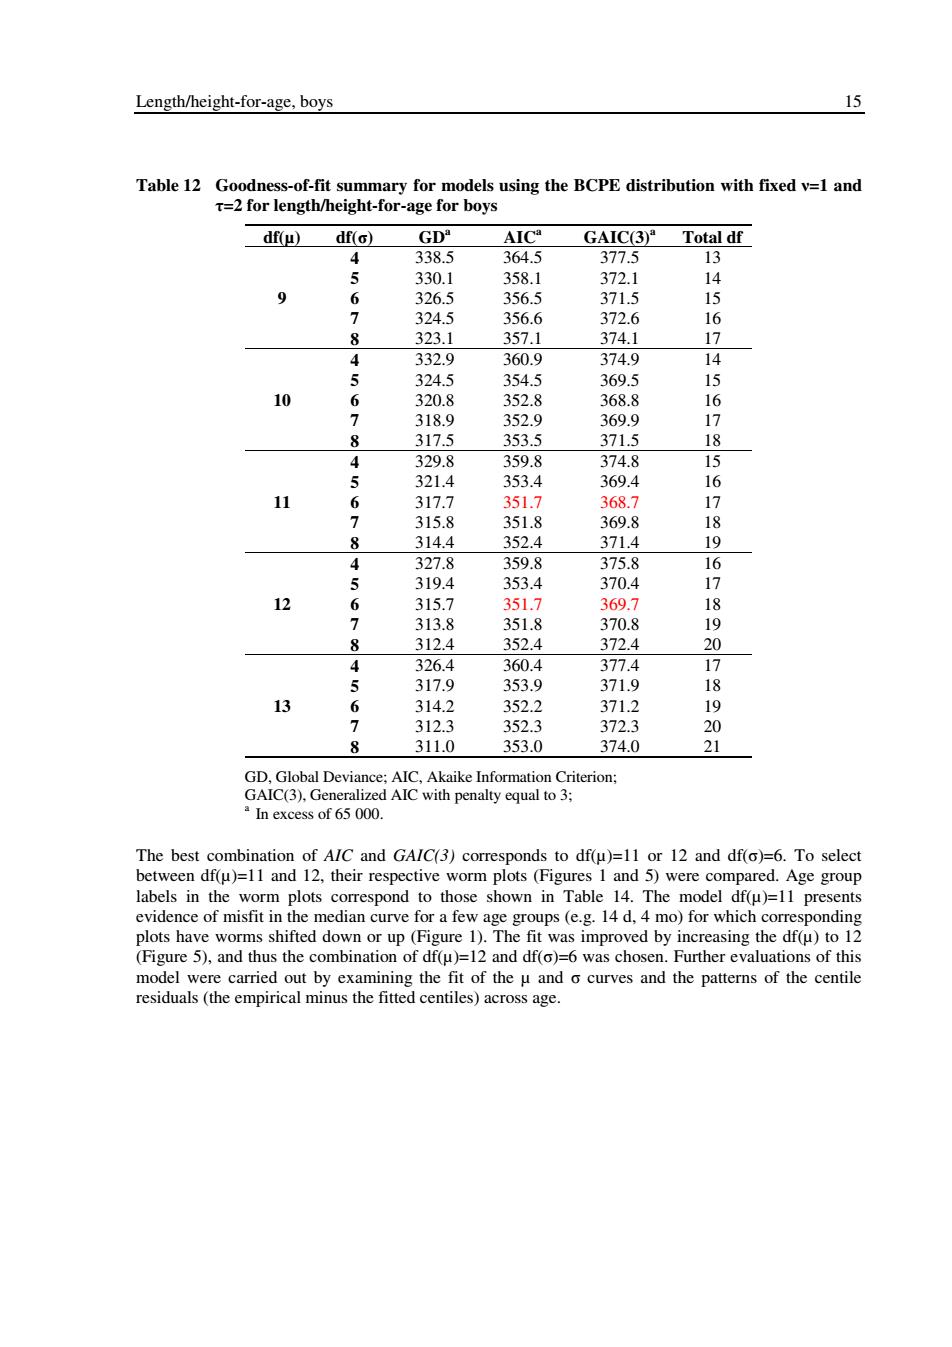
Length/height-for-age, boys 15 Table 12 Goodness-of-fit summary for models using the BCPE distribution with fixed ν=1 and τ=2 for length/height-for-age for boys df(µ) df(σ) GDa AICa GAIC(3)a Total df 4 338.5 364.5 377.5 13 5 330.1 358.1 372.1 14 6 326.5 356.5 371.5 15 7 324.5 356.6 372.6 16 9 8 323.1 357.1 374.1 17 4 332.9 360.9 374.9 14 5 324.5 354.5 369.5 15 6 320.8 352.8 368.8 16 7 318.9 352.9 369.9 17 10 8 317.5 353.5 371.5 18 4 329.8 359.8 374.8 15 5 321.4 353.4 369.4 16 6 317.7 351.7 368.7 17 7 315.8 351.8 369.8 18 11 8 314.4 352.4 371.4 19 4 327.8 359.8 375.8 16 5 319.4 353.4 370.4 17 6 315.7 351.7 369.7 18 7 313.8 351.8 370.8 19 12 8 312.4 352.4 372.4 20 4 326.4 360.4 377.4 17 5 317.9 353.9 371.9 18 6 314.2 352.2 371.2 19 7 312.3 352.3 372.3 20 13 8 311.0 353.0 374.0 21 GD, Global Deviance; AIC, Akaike Information Criterion; GAIC(3), Generalized AIC with penalty equal to 3; a In excess of 65 000. The best combination of AIC and GAIC(3) corresponds to df(µ)=11 or 12 and df(σ)=6. To select between df(µ)=11 and 12, their respective worm plots (Figures 1 and 5) were compared. Age group labels in the worm plots correspond to those shown in Table 14. The model df(µ)=11 presents evidence of misfit in the median curve for a few age groups (e.g. 14 d, 4 mo) for which corresponding plots have worms shifted down or up (Figure 1). The fit was improved by increasing the df(µ) to 12 (Figure 5), and thus the combination of df(µ)=12 and df(σ)=6 was chosen. Further evaluations of this model were carried out by examining the fit of the µ and σ curves and the patterns of the centile residuals (the empirical minus the fitted centiles) across age
16 Length/height-for-age,boys 3 46m0 52m0 58m0 64m0 70 mo 20m0 22m0 10 mo 110 12 mo 16,mo 181 uoneneg 5m0 6 mo 8 mo Birth 280 3mo 3 3 1 123 3 Unit normal quantile Figure 1 Worm plots of z-scores for candidate model with df(u)=11 and df()=6 with age transformation age35 for length/height-for-age for boys Model1:BCPE(x=age35,df(p)=12,df(@)=6,v=1,t=2) The fitted parameter curves show adequate smoothing despite the erratic coefficient of variation in the cross-sectional sample's height (Figure 2).The residual plots of the fitted centiles for the period 0 to 24 months (Figure 3)showed no evidence of bias.For the age range 24 to 71 months,residuals of the fitted centiles showed a non-random pattern for the 50 centile,but were smaller than 0.6 cm up to 60 months where estimated SDs vary from 3.5 to 5 cm (Figure 4). Table 13 shows the proportions of children with length(or height)below the fitted centiles.Age group labels correspond to the same age intervals provided in Table 14.Overall,there was no evidence of systematic departures from expected patterns suggestive of bias.Overestimates in the median (50h centile)for the age groups 14 d(55%),2 mo (54%)and 40 mo (56%)were noted.The opposite was observed for the age group 70 mo (46%),i.e.the median was underestimated.The clinical significance of these few observed differences between fitted and observed proportions is likely to be small
16 Length/height-for-age, boys -0.4 0.0 0.4 -3 -1 1 2 3 -3 -1 1 2 3 -3 -1 1 2 3 -0.4 0.0 0.4 -0.4 0.0 0.4 -0.4 0.0 0.4 -3 -1 1 2 3 -0.4 0.0 0.4 -3 -1 1 2 3 -3 -1 1 2 3 Unit normal quantile Deviation Birth 14 d 28 d 42 d 2 mo 3 mo 4 mo 5 mo 6 mo 7 mo 8 mo 9 mo 10 mo 11 mo 12 mo 14 mo 16 mo 18 mo 20 mo 22 mo 24 mo 28 mo 34 mo 40 mo 46 mo 52 mo 58 mo 64 mo 70 mo -0.4 0.0 0.4 -3 -1 1 2 3 -3 -1 1 2 3 -3 -1 1 2 3 -0.4 0.0 0.4 -0.4 0.0 0.4 -0.4 0.0 0.4 -3 -1 1 2 3 -0.4 0.0 0.4 -3 -1 1 2 3 -3 -1 1 2 3 Unit normal quantile Deviation Birth 14 d 28 d 42 d 2 mo 3 mo 4 mo 5 mo 6 mo 7 mo 8 mo 9 mo 10 mo 11 mo 12 mo 14 mo 16 mo 18 mo 20 mo 22 mo 24 mo 28 mo 34 mo 40 mo 46 mo 52 mo 58 mo 64 mo 70 mo Birth 14 d 28 d 42 d 2 mo 3 mo 4 mo 5 mo 6 mo 7 mo 8 mo 9 mo 10 mo 11 mo 12 mo 14 mo 16 mo 18 mo 20 mo 22 mo 24 mo 28 mo 34 mo 40 mo 46 mo 52 mo 58 mo 64 mo 70 mo Figure 1 Worm plots of z-scores for candidate model with df(µ)=11 and df(σ)=6 with age transformation age0.35 for length/height-for-age for boys Model 1: BCPE(x=age0.35, df(µ)=12, df(σ)=6, ν=1, τ=2) The fitted parameter curves show adequate smoothing despite the erratic coefficient of variation in the cross-sectional sample's height (Figure 2). The residual plots of the fitted centiles for the period 0 to 24 months (Figure 3) showed no evidence of bias. For the age range 24 to 71 months, residuals of the fitted centiles showed a non-random pattern for the 50th centile, but were smaller than 0.6 cm up to 60 months where estimated SDs vary from 3.5 to 5 cm (Figure 4). Table 13 shows the proportions of children with length (or height) below the fitted centiles. Age group labels correspond to the same age intervals provided in Table 14. Overall, there was no evidence of systematic departures from expected patterns suggestive of bias. Overestimates in the median (50th centile) for the age groups 14 d (55%), 2 mo (54%) and 40 mo (56%) were noted. The opposite was observed for the age group 70 mo (46%), i.e. the median was underestimated. The clinical significance of these few observed differences between fitted and observed proportions is likely to be small
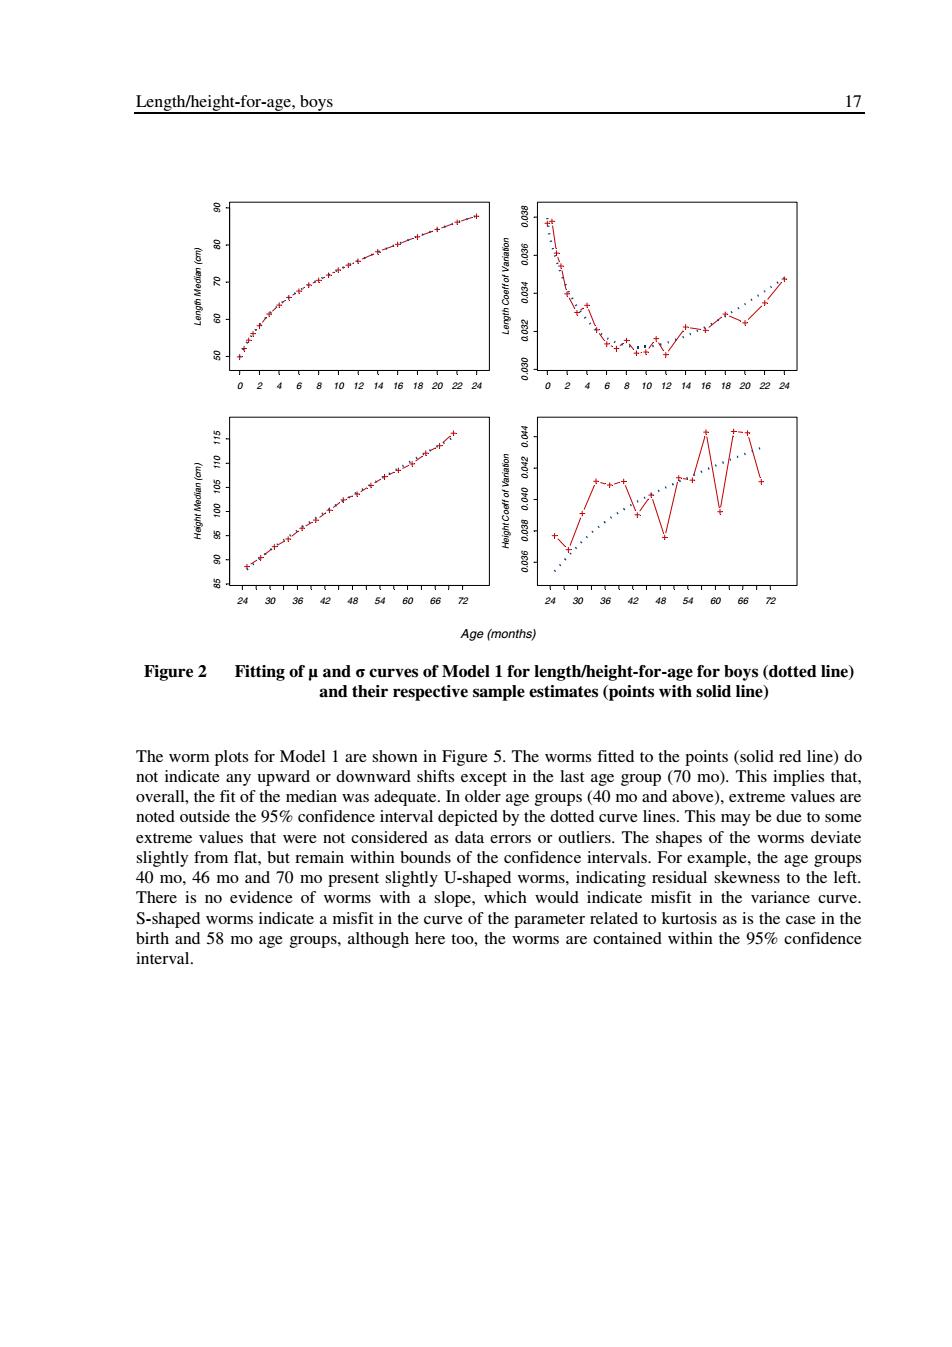
Length/height-for-age,boys 17 860.0 种 品 品 12 14 16 18 2022 24 10 12 20 22 24 008000000006000600 品 48546066 72 24 30 48 54 60 6672 Age (months) Figure 2 Fitting of u and o curves of Model 1 for length/height-for-age for boys(dotted line) and their respective sample estimates(points with solid line) The worm plots for Model 1 are shown in Figure 5.The worms fitted to the points(solid red line)do not indicate any upward or downward shifts except in the last age group(70 mo).This implies that, overall,the fit of the median was adequate.In older age groups(40 mo and above),extreme values are noted outside the 95%confidence interval depicted by the dotted curve lines.This may be due to some extreme values that were not considered as data errors or outliers.The shapes of the worms deviate slightly from flat,but remain within bounds of the confidence intervals.For example,the age groups 40 mo,46 mo and 70 mo present slightly U-shaped worms,indicating residual skewness to the left. There is no evidence of worms with a slope,which would indicate misfit in the variance curve. S-shaped worms indicate a misfit in the curve of the parameter related to kurtosis as is the case in the birth and 58 mo age groups,although here too,the worms are contained within the 95%confidence interval
Length/height-for-age, boys 17 Length Median (cm) 50 60 70 80 90 0 2 4 6 8 10 12 14 16 18 20 22 24 Length Coeff of Variation 0.030 0.032 0.034 0.036 0.038 0 2 4 6 8 10 12 14 16 18 20 22 24 Height Median (cm) 85 90 95 100 105 110 115 24 30 36 42 48 54 60 66 72 Height Coeff of Variation 0.036 0.038 0.040 0.042 0.044 24 30 36 42 48 54 60 66 72 Age (months) Figure 2 Fitting of µ and σ curves of Model 1 for length/height-for-age for boys (dotted line) and their respective sample estimates (points with solid line) The worm plots for Model 1 are shown in Figure 5. The worms fitted to the points (solid red line) do not indicate any upward or downward shifts except in the last age group (70 mo). This implies that, overall, the fit of the median was adequate. In older age groups (40 mo and above), extreme values are noted outside the 95% confidence interval depicted by the dotted curve lines. This may be due to some extreme values that were not considered as data errors or outliers. The shapes of the worms deviate slightly from flat, but remain within bounds of the confidence intervals. For example, the age groups 40 mo, 46 mo and 70 mo present slightly U-shaped worms, indicating residual skewness to the left. There is no evidence of worms with a slope, which would indicate misfit in the variance curve. S-shaped worms indicate a misfit in the curve of the parameter related to kurtosis as is the case in the birth and 58 mo age groups, although here too, the worms are contained within the 95% confidence interval
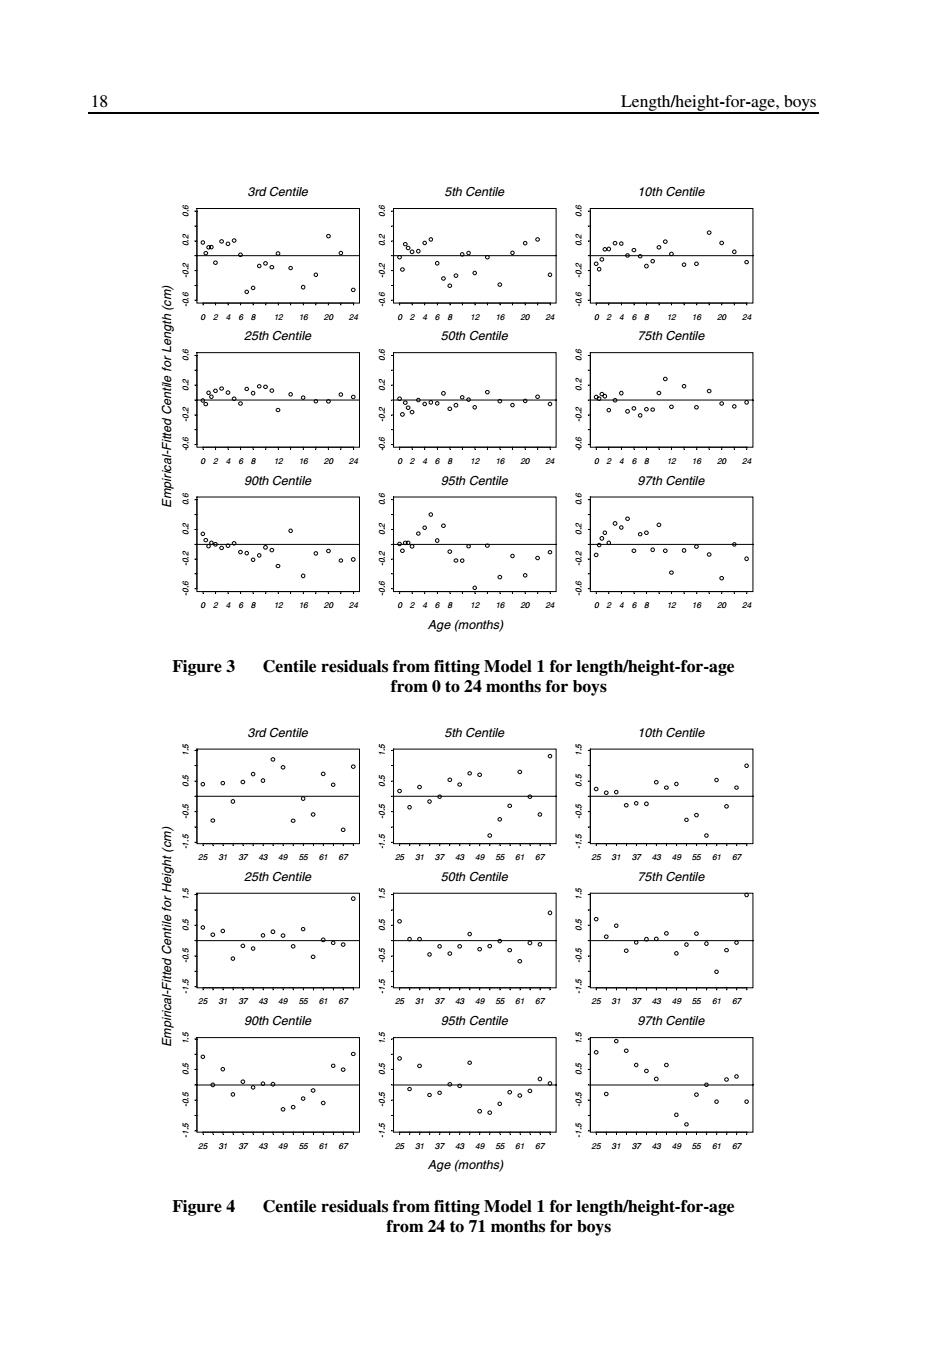
18 Length/height-for-age,boys 3rd Centile 5th Centile 10th Centile Q 0°。 0。 02468 1218 20 02468 12 16 24 02468 1216 20 24 25th Centile 50th Centile 75th Centile 点 0 0 0。 00°。00 02468 12 1620 24 0246812 1620 02468121620 24 90th Centile 95th Centile 97th Centile g 0 60 0 00 02468 16. 24 02468 16 02468 12 24 Age(months) Figure 3 Centile residuals from fitting Model 1 for length/height-for-age from 0 to 24 months for boys 3rd Centile 5th Centile 10th Centile 0 2 。。°。 0 g 0。 0. 0 0 000 0 (o) 0 0 25 313743495 6167 25 31 374349558167 25 31 37 43495561 67 25th Centile 50th Centile 75th Centile 3 00 0 00 9 25 31374349556167 25 31 374349556167 25 31374349556167 90th Centile 95th Centile 97th Centile 0 3 0 0 0 2531 37 43 49556167 25 31374349556167 253137434g556167 Age(months) Figure 4 Centile residuals from fitting Model 1 for length/height-for-age from 24 to 71 months for boys
18 Length/height-for-age, boys 3rd Centile -0.6 -0.2 0.2 0.6 0 2 4 6 8 12 16 20 24 5th Centile -0.6 -0.2 0.2 0.6 0 2 4 6 8 12 16 20 24 10th Centile -0.6 -0.2 0.2 0.6 0 2 4 6 8 12 16 20 24 25th Centile -0.6 -0.2 0.2 0.6 0 2 4 6 8 12 16 20 24 50th Centile -0.6 -0.2 0.2 0.6 0 2 4 6 8 12 16 20 24 75th Centile -0.6 -0.2 0.2 0.6 0 2 4 6 8 12 16 20 24 90th Centile -0.6 -0.2 0.2 0.6 0 2 4 6 8 12 16 20 24 95th Centile -0.6 -0.2 0.2 0.6 0 2 4 6 8 12 16 20 24 97th Centile -0.6 -0.2 0.2 0.6 0 2 4 6 8 12 16 20 24 Age (months) Empirical-Fitted Centile for Length (cm) Figure 3 Centile residuals from fitting Model 1 for length/height-for-age from 0 to 24 months for boys 3rd Centile -1.5 -0.5 0.5 1.5 25 31 37 43 49 55 61 67 5th Centile -1.5 -0.5 0.5 1.5 25 31 37 43 49 55 61 67 10th Centile -1.5 -0.5 0.5 1.5 25 31 37 43 49 55 61 67 25th Centile -1.5 -0.5 0.5 1.5 25 31 37 43 49 55 61 67 50th Centile -1.5 -0.5 0.5 1.5 25 31 37 43 49 55 61 67 75th Centile -1.5 -0.5 0.5 1.5 25 31 37 43 49 55 61 67 90th Centile -1.5 -0.5 0.5 1.5 25 31 37 43 49 55 61 67 95th Centile -1.5 -0.5 0.5 1.5 25 31 37 43 49 55 61 67 97th Centile -1.5 -0.5 0.5 1.5 25 31 37 43 49 55 61 67 Age (months) Empirical-Fitted Centile for Height (cm) Figure 4 Centile residuals from fitting Model 1 for length/height-for-age from 24 to 71 months for boys

Length/height-for-age,boys 19 3 -1123 0 52m0 58m0 64mo -70m0 20 mo 22m0 24m0 28m0. 40 mo 10mo 11 mo 12mo 14 mo 16mo 18 mo uoneieg mo 5m0 8 mo 9 mo Birth 28d 42d no 3m0 -3 1 123 123 3 123 Unit normal quantile Figure 5 Worm plots of z-scores for Model 1 for length/height-for-age for boys
Length/height-for-age, boys 19 -0.4 0.0 0.4 -3 -1 1 2 3 -3 -1 1 2 3 -3 -1 1 2 3 -0.4 0.0 0.4 -0.4 0.0 0.4 -0.4 0.0 0.4 -3 -1 1 2 3 -0.4 0.0 0.4 -3 -1 1 2 3 -3 -1 1 2 3 Unit normal quantile Deviation Birth 14 d 28 d 42 d 2 mo 3 mo 4 mo 5 mo 6 mo 7 mo 8 mo 9 mo 10 mo 11 mo 12 mo 14 mo 16 mo 18 mo 20 mo 22 mo 24 mo 28 mo 34 mo 40 mo 46 mo 52 mo 58 mo 64 mo 70 mo -0.4 0.0 0.4 -3 -1 1 2 3 -3 -1 1 2 3 -3 -1 1 2 3 -0.4 0.0 0.4 -0.4 0.0 0.4 -0.4 0.0 0.4 -3 -1 1 2 3 -0.4 0.0 0.4 -3 -1 1 2 3 -3 -1 1 2 3 Unit normal quantile Deviation Birth 14 d 28 d 42 d 2 mo 3 mo 4 mo 5 mo 6 mo 7 mo 8 mo 9 mo 10 mo 11 mo 12 mo 14 mo 16 mo 18 mo 20 mo 22 mo 24 mo 28 mo 34 mo 40 mo 46 mo 52 mo 58 mo 64 mo 70 mo Birth 14 d 28 d 42 d 2 mo 3 mo 4 mo 5 mo 6 mo 7 mo 8 mo 9 mo 10 mo 11 mo 12 mo 14 mo 16 mo 18 mo 20 mo 22 mo 24 mo 28 mo 34 mo 40 mo 46 mo 52 mo 58 mo 64 mo 70 mo Figure 5 Worm plots of z-scores for Model 1 for length/height-for-age for boys