WHO Child Growth Standards Length/height-for-age,weight-for-age,weight-for-length, weight-for-height and body mass index-for-age Methods and development 1 year years 3 years 4 years 5 years World Health Organization
In 1993 the World Health Organization (WHO) undertook a comprehensive review of the uses and interpretation of anthropometric references. The review concluded that the NCHS/WHO growth reference, which had been recommended for international use since the late 1970s, did not adequately represent early childhood growth and that new growth curves were necessary. The World Health Assembly endorsed this recommendation in 1994. The WHO Multicentre Growth Reference Study (MGRS) was undertaken in response to that endorsement and implemented between 1997 and 2003 to generate new curves for assessing the growth and development of children the world over. The MGRS collected primary growth data and related information from 8440 healthy breastfed infants and young children from diverse ethnic backgrounds and cultural settings (Brazil, Ghana, India, Norway, Oman and USA). The growth standards developed based on these data and presented in this report provide a technically robust tool that represents the best description of physiological growth for children under five years of age. The standards depict normal early childhood growth under optimal environmental conditions and can be used to assess children everywhere, regardless of ethnicity, socioeconomic status and type of feeding. WHO Child Growth Standards WHO Child Growth Standards 1 year 2 years 3 years 4 years 5 years Length/height-for-age, weight-for-age, weight-for-length, weight-for-height and body mass index-for-age Methods and development WHO Child Growth Standards - Methods and development ISBN 92 4 154693 X
Contents Executive summary xvii 1.Introduction 1 2.Methodology 2.1 Design of the WHO Multicentre Growth Reference Study 3 2.2 Anthropometry methods 2.3 Sample description 2.4 Data cleaning procedures and exclusions 2.5 Statistical methods for constructing the growth curves 7 3.Construction of the length/height-for-age standards 13 3.1 Indicator-specific methodology 13 3.2 Length/height-for-age for boys 13 3.2.1 Sample size 13 3.2.2 Model selection and results 3.2.3 WHO standards and their comparison with NCHS and CDC 2000 references 3 Charts 33 Tables 37 Comparison with NCHS 45 Comparison with CDC 2000 4 3.3 Length/height-for-age for girls 3.3.1 Sample size 47 3.3.2 Model selection and results 47 3.3.3 WHO standards and their comparison with NCHS and CDC 2000 references 59 Charts 60 Tables 64 Comparison with NCHS 7 Comparison with CDC 2000 3.4 Comparisons between boys and girls 4 3.4.1WHO 7 3.4.2 NCHS 7 3.4.3CDC2000 7 4.Construction of the weight-for-age standards 79 4.1 Indicator-specific methodology 4.2 Weight-for-age for boys 79 4.2.1 Sample size 4.2.2 Model selection and results 79 4.2.3 WHO standards and their comparison with NCHS and CDC 2000 references 94 Charts 95 Tables 97 Comparison with NCHS 105 Comparison with CDC 2000 106 4.3 Weight-for-age for girls 107 4.3.1 Sample size 107 4.3.2 Model selection and results 107 4.3.3 WHO standards and their comparison with NCHS and CDC 2000 references 122 Charts 123 Tables 125 Comparison with NCHS 133 Comparison with CDC 2000 134 4.4 Comparisons between boys and girls 135 4.4.1WHO 136 4.4.2 NCHS 137 -V-
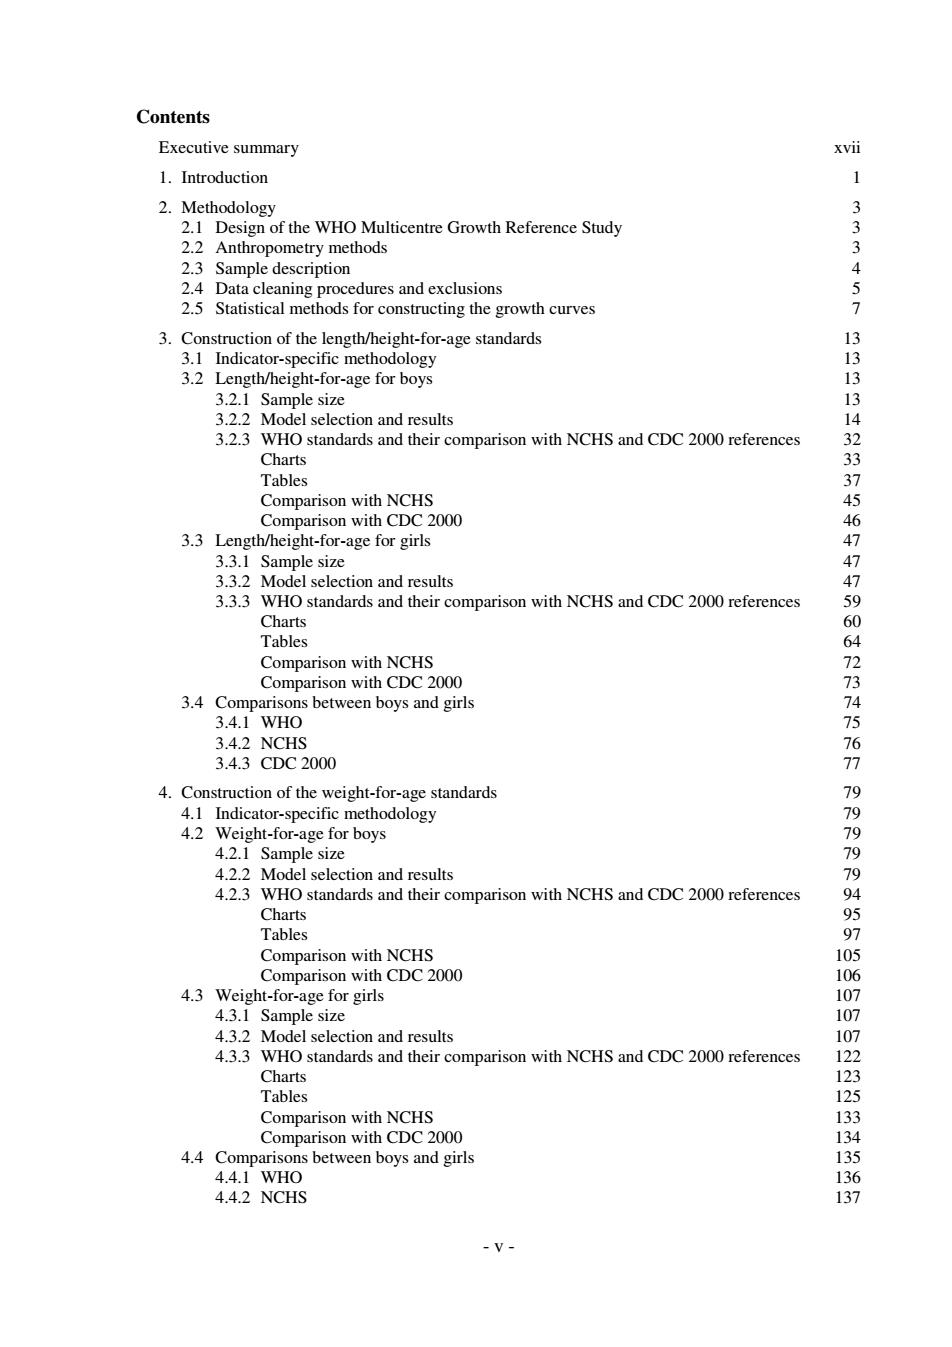
- v - Contents Executive summary xvii 1. Introduction 1 2. Methodology 3 2.1 Design of the WHO Multicentre Growth Reference Study 3 2.2 Anthropometry methods 3 2.3 Sample description 4 2.4 Data cleaning procedures and exclusions 5 2.5 Statistical methods for constructing the growth curves 7 3. Construction of the length/height-for-age standards 13 3.1 Indicator-specific methodology 13 3.2 Length/height-for-age for boys 13 3.2.1 Sample size 13 3.2.2 Model selection and results 14 3.2.3 WHO standards and their comparison with NCHS and CDC 2000 references 32 Charts 33 Tables 37 Comparison with NCHS 45 Comparison with CDC 2000 46 3.3 Length/height-for-age for girls 47 3.3.1 Sample size 47 3.3.2 Model selection and results 47 3.3.3 WHO standards and their comparison with NCHS and CDC 2000 references 59 Charts 60 Tables 64 Comparison with NCHS 72 Comparison with CDC 2000 73 3.4 Comparisons between boys and girls 74 3.4.1 WHO 75 3.4.2 NCHS 76 3.4.3 CDC 2000 77 4. Construction of the weight-for-age standards 79 4.1 Indicator-specific methodology 79 4.2 Weight-for-age for boys 79 4.2.1 Sample size 79 4.2.2 Model selection and results 79 4.2.3 WHO standards and their comparison with NCHS and CDC 2000 references 94 Charts 95 Tables 97 Comparison with NCHS 105 Comparison with CDC 2000 106 4.3 Weight-for-age for girls 107 4.3.1 Sample size 107 4.3.2 Model selection and results 107 4.3.3 WHO standards and their comparison with NCHS and CDC 2000 references 122 Charts 123 Tables 125 Comparison with NCHS 133 Comparison with CDC 2000 134 4.4 Comparisons between boys and girls 135 4.4.1 WHO 136 4.4.2 NCHS 137
4.4.3CDC2000 138 5.Construction of the weight-for-length and weight-for-height standards 139 5.1 Indicator-specific methodology 139 5.2 Weight-for-length/height for boys 139 5.2.1 Sample size 139 5.2.2 Model selection and results 140 5.2.3 WHO standards and their comparison with NCHS and CDC 2000 references 153 Charts 154 Tables 158 Comparison with NCHS 176 Comparison with CDC 2000 178 5.3 Weight-for-length/height for girls 180 5.3.1 Sample size 180 5.3.2 Model selection and results 180 5.3.3 WHO standards and their comparison with NCHS and CDC 2000 references 194 Charts 195 Tables 199 Comparison with NCHS 217 Comparison with CDC 2000 219 5.4 Comparisons between boys and girls 221 5.4.1WH0 222 5.4.2 NCHS 224 5.4.3CDC2000 226 6.Construction of the body mass index-for-age standards 229 6.1 Indicator-specific methodology 229 6.2 BMI-for-age for boys 230 6.2.1 Sample size 230 6.2.2 Model selection and results 230 Length-based BMI-for-age for boys 230 Height-based BMI-for-age for boys 241 6.2.3 WHO standards and their comparison with CDC 2000 reference 249 Charts 250 Tables 254 Comparison with CDC 2000 262 6.3 BMI-for-age for girls 263 6.3.1 Sample size 263 6.3.2 Model selection and results 263 Length-based BMI-for-age for girls 263 Height-based BMI-for-age for girls 275 6.3.3 WHO standards and their comparison with CDC 2000 reference 284 Charts 285 Tables 289 Comparison with CDC 2000 297 6.4 Comparisons between boys and girls 298 6.4.1WH0 299 6.4.2CDC2000 300 7.Computation of centiles and z-scores for length/height-for-age,weight-for-age, weight-for-length,weight-for-height and BMI-for-age 301 8.Conclusion 305 9.Bibliography 309 Appendix A.Model specifications of the WHO child growth standards 312 vi
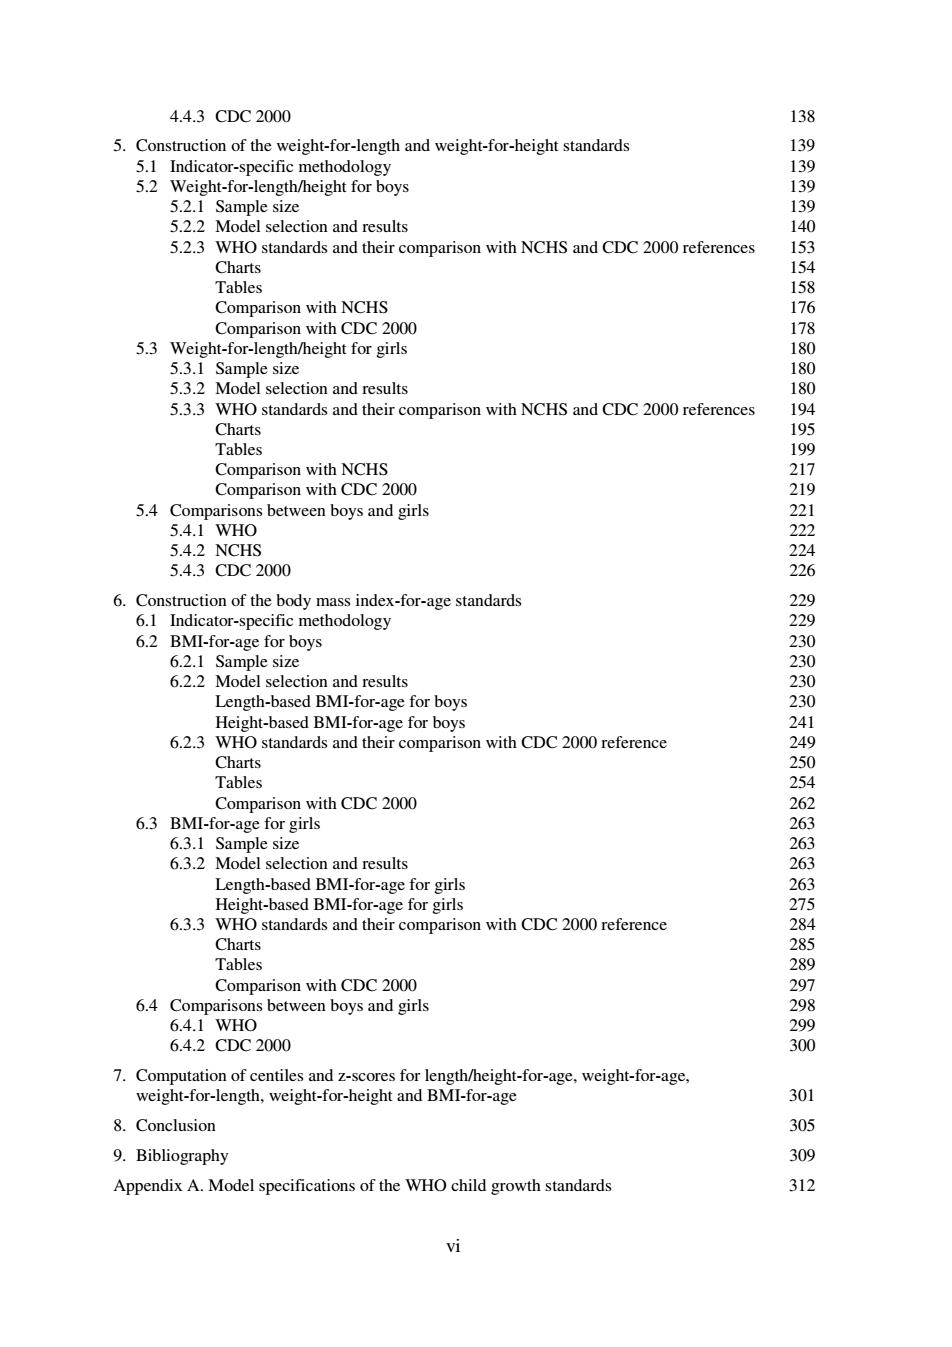
vi 4.4.3 CDC 2000 138 5. Construction of the weight-for-length and weight-for-height standards 139 5.1 Indicator-specific methodology 139 5.2 Weight-for-length/height for boys 139 5.2.1 Sample size 139 5.2.2 Model selection and results 140 5.2.3 WHO standards and their comparison with NCHS and CDC 2000 references 153 Charts 154 Tables 158 Comparison with NCHS 176 Comparison with CDC 2000 178 5.3 Weight-for-length/height for girls 180 5.3.1 Sample size 180 5.3.2 Model selection and results 180 5.3.3 WHO standards and their comparison with NCHS and CDC 2000 references 194 Charts 195 Tables 199 Comparison with NCHS 217 Comparison with CDC 2000 219 5.4 Comparisons between boys and girls 221 5.4.1 WHO 222 5.4.2 NCHS 224 5.4.3 CDC 2000 226 6. Construction of the body mass index-for-age standards 229 6.1 Indicator-specific methodology 229 6.2 BMI-for-age for boys 230 6.2.1 Sample size 230 6.2.2 Model selection and results 230 Length-based BMI-for-age for boys 230 Height-based BMI-for-age for boys 241 6.2.3 WHO standards and their comparison with CDC 2000 reference 249 Charts 250 Tables 254 Comparison with CDC 2000 262 6.3 BMI-for-age for girls 263 6.3.1 Sample size 263 6.3.2 Model selection and results 263 Length-based BMI-for-age for girls 263 Height-based BMI-for-age for girls 275 6.3.3 WHO standards and their comparison with CDC 2000 reference 284 Charts 285 Tables 289 Comparison with CDC 2000 297 6.4 Comparisons between boys and girls 298 6.4.1 WHO 299 6.4.2 CDC 2000 300 7. Computation of centiles and z-scores for length/height-for-age, weight-for-age, weight-for-length, weight-for-height and BMI-for-age 301 8. Conclusion 305 9. Bibliography 309 Appendix A. Model specifications of the WHO child growth standards 312
Figures Figure 1 Worm plots of z-scores for candidate model with df(u)=11 and df(o)=6 with age transformation age35 for length/height-for-age for boys 16 Figure 2 Fitting of u and o curves of Model 1 for length/height-for-age for boys (dotted line)and their respective sample estimates(points with solid line) Figure 3 Centile residuals from fitting Model 1 for length/height-for-age from 0 to 24 months for boys 18 Figure 4 Centile residuals from fitting Model 1 for length/height-for-age from 24 to 71 months for boys 18 Figure 5 Worm plots of z-scores for Model 1 for length/height-for-age for boys 19 Figure 6 Worm plots of z-scores for Model 2 for length/height-for-age for boys 24 Figure 7 3rd,10th,50th,90th,97th smoothed centile curves and empirical values: length-for-age for boys from birth to 24 months 28 Figure 8 5th,25th,50th,75th,95th smoothed centile curves and empirical values: length-for-age for boys from birth to 24 months 29 Figure 9 3rd,10th,50th,90th,97th smoothed centile curves and empirical values: height-for-age for boys from 24 to 71 months 30 Figure 10 5th,25th,50th,75th,95th smoothed centile curves and empirical values: height-for-age for boys from 24 to 71 months 31 Figure 11 WHO length-for-age z-scores for boys from birth to 24 months 33 Figure 12 WHO height-for-age z-scores for boys from 24 to 60 months 34 Figure 13 WHO length-for-age percentiles for boys from birth to 24 months 35 Figure 14 WHO height-for-age percentiles for boys from 24 to 60 months 36 Figure 15 Comparison of WHO with NCHS length/height-for-age z-scores for boys 45 Figure 16 Comparison of WHO with CDC 2000 length/height-for-age z-scores for boys 46 Figure 17 Fitting of the u and o curves of Model 1 for length/height-for-age for girls (dotted line)and their respective sample estimates (points with solid line) 49 Figure 18 Centile residuals from fitting Model 1 for length/height-for-age from 0 to 24 months for girls 50 Figure 19 Centile residuals from fitting Model 1 for length/height-for-age from 24 to 71 months for girls 50 Figure 20 Worm plots of z-scores for Model 1 for length/height-for-age for girls 51 Figure 21 3rd,10th,50th,90th,97th smoothed centile curves and empirical values: length-for-age for girls from birth to 24 months 55 Figure 22 5th,25th,50th,75th,95th smoothed centile curves and empirical values: length-for-age for girls from birth to 24 months 56 Figure 23 3rd,10th,50th,90th,97th smoothed centile curves and empirical values: height-for-age for girls from 24 to 71 months 57 Figure 24 5th,25th,50th,75th,95th smoothed centile curves and empirical values: height-for-age for girls from 24 to 71 months 58 Figure 25 WHO length-for-age z-scores for girls from birth to 24 months 60 Figure 26 WHO height-for-age z-scores for girls from 24 to 60 months 61 -vii-
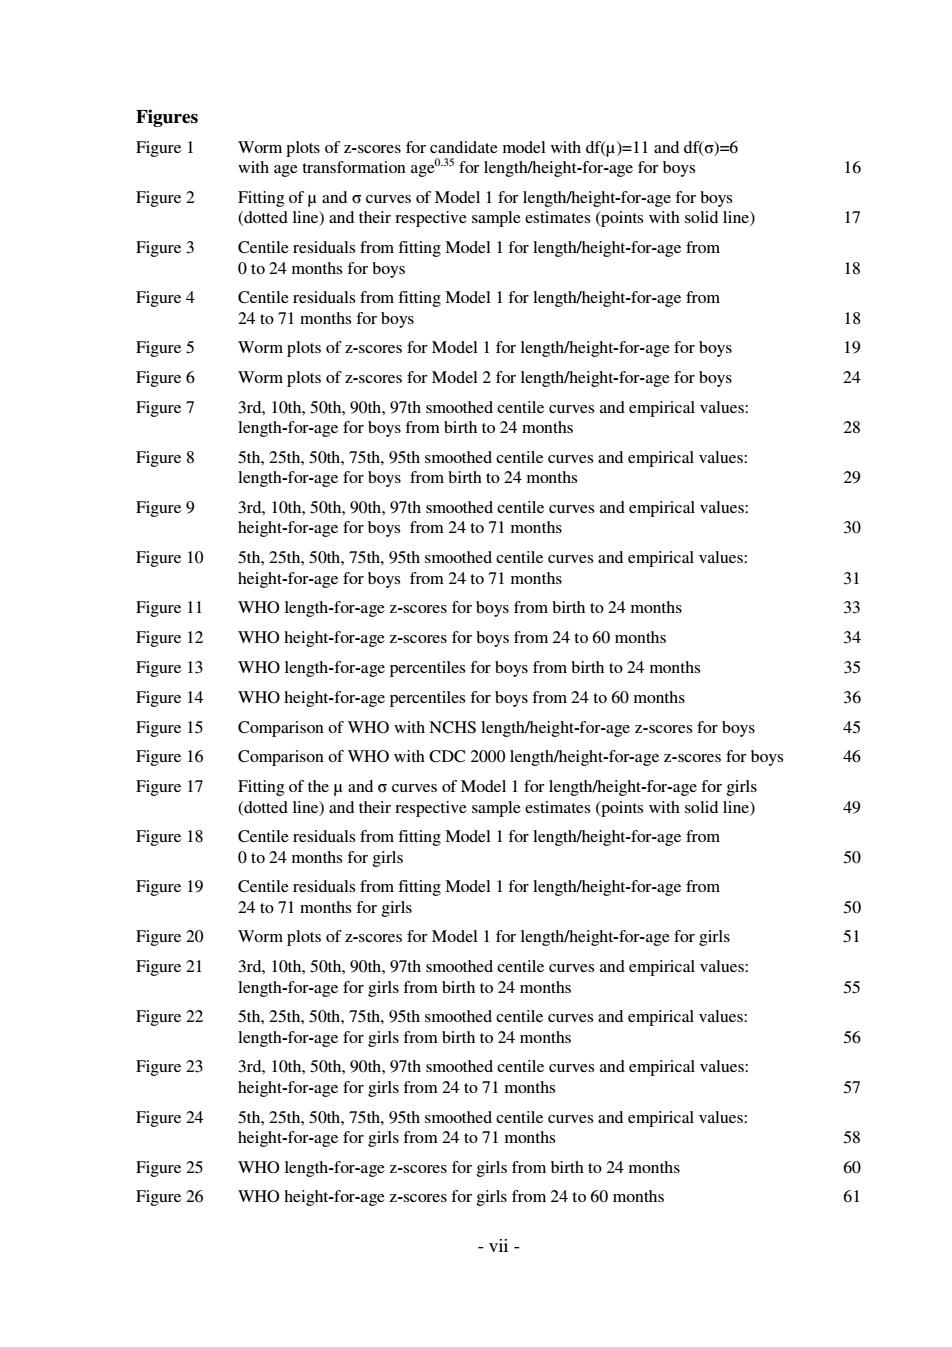
- vii - Figures Figure 1 Worm plots of z-scores for candidate model with df(µ)=11 and df(σ)=6 with age transformation age0.35 for length/height-for-age for boys 16 Figure 2 Fitting of µ and σ curves of Model 1 for length/height-for-age for boys (dotted line) and their respective sample estimates (points with solid line) 17 Figure 3 Centile residuals from fitting Model 1 for length/height-for-age from 0 to 24 months for boys 18 Figure 4 Centile residuals from fitting Model 1 for length/height-for-age from 24 to 71 months for boys 18 Figure 5 Worm plots of z-scores for Model 1 for length/height-for-age for boys 19 Figure 6 Worm plots of z-scores for Model 2 for length/height-for-age for boys 24 Figure 7 3rd, 10th, 50th, 90th, 97th smoothed centile curves and empirical values: length-for-age for boys from birth to 24 months 28 Figure 8 5th, 25th, 50th, 75th, 95th smoothed centile curves and empirical values: length-for-age for boys from birth to 24 months 29 Figure 9 3rd, 10th, 50th, 90th, 97th smoothed centile curves and empirical values: height-for-age for boys from 24 to 71 months 30 Figure 10 5th, 25th, 50th, 75th, 95th smoothed centile curves and empirical values: height-for-age for boys from 24 to 71 months 31 Figure 11 WHO length-for-age z-scores for boys from birth to 24 months 33 Figure 12 WHO height-for-age z-scores for boys from 24 to 60 months 34 Figure 13 WHO length-for-age percentiles for boys from birth to 24 months 35 Figure 14 WHO height-for-age percentiles for boys from 24 to 60 months 36 Figure 15 Comparison of WHO with NCHS length/height-for-age z-scores for boys 45 Figure 16 Comparison of WHO with CDC 2000 length/height-for-age z-scores for boys 46 Figure 17 Fitting of the µ and σ curves of Model 1 for length/height-for-age for girls (dotted line) and their respective sample estimates (points with solid line) 49 Figure 18 Centile residuals from fitting Model 1 for length/height-for-age from 0 to 24 months for girls 50 Figure 19 Centile residuals from fitting Model 1 for length/height-for-age from 24 to 71 months for girls 50 Figure 20 Worm plots of z-scores for Model 1 for length/height-for-age for girls 51 Figure 21 3rd, 10th, 50th, 90th, 97th smoothed centile curves and empirical values: length-for-age for girls from birth to 24 months 55 Figure 22 5th, 25th, 50th, 75th, 95th smoothed centile curves and empirical values: length-for-age for girls from birth to 24 months 56 Figure 23 3rd, 10th, 50th, 90th, 97th smoothed centile curves and empirical values: height-for-age for girls from 24 to 71 months 57 Figure 24 5th, 25th, 50th, 75th, 95th smoothed centile curves and empirical values: height-for-age for girls from 24 to 71 months 58 Figure 25 WHO length-for-age z-scores for girls from birth to 24 months 60 Figure 26 WHO height-for-age z-scores for girls from 24 to 60 months 61
Figure 27 WHO length-for-age percentiles for girls from birth to 24 months 62 Figure 28 WHO height-for-age percentiles for girls from 24 to 60 months 63 Figure 29 Comparison of WHO with NCHS length/height-for-age z-scores for girls 72 Figure 30 Comparison of WHO with CDC 2000 length/height-for-age z-scores for girls 73 Figure 31 Comparison of boys'and girls'WHO length/height-for-age z-scores 75 Figure 32 Comparison of boys'and girls'NCHS length/height-for-age z-scores 76 Figure 33 Comparison of boys'and girls'CDC 2000 length/height-for-age z-scores 77 Figure 34 Worm plots of z-scores for Model 1 for weight-for-age for boys 81 Figure 35 Fitting of the u,o,and v curves of Model 2 for weight-for-age for boys from 0 to 71 months (dotted line)and their respective sample estimates (points with solid line) 84 Figure 36 Centile residuals from fitting Model 2 for weight-for-age from 0 to 24 months for boys 85 Figure 37 Centile residuals from fitting Model 2 for weight-for-age from 24 to 71 months for boys 85 Figure 38 Worm plots of z-scores for Model 2 for weight-for-age for boys 86 Figure 39 3rd,10th,50th,90th,97th smoothed centile curves and empirical values: weight-for-age for boys from birth to 24 months 90 Figure 40 5th,25th,50th,75th,95th smoothed centile curves and empirical values: weight-for-age for boys from birth to 24 months 91 Figure 41 3rd,10th,50th,90th,97th smoothed centile curves and empirical values: weight-for-age for boys from 24 to 71 months 92 Figure 42 5th,25th,50th,75th,95th smoothed centile curves and empirical values: weight-for-age for boys from 24 to 71 months 93 Figure 43 WHO weight-for-age z-scores for boys from birth to 60 months 95 Figure 44 WHO weight-for-age percentiles for boys from birth to 60 months 96 Figure 45 Comparison of WHO with NCHS weight-for-age z-scores for boys 105 Figure 46 Comparison of WHO with CDC 2000 weight-for-age z-scores for boys 106 Figure 47 Cubic splines fitted for the v curve with varying numbers of degrees of freedom 110 Figure 48 Fitting of the u,o,and v curves of Model 3 for weight-for-age for girls from 0 to 71 months(dotted line)and their respective sample estimates (points with solid line) 113 Figure 49 Centile residuals from fitting Model 3 for weight-for-age from 0 to 24 months for girls 114 Figure 50 Centile residuals from fitting Model 3 for weight-for-age from 24 to 71 months for girls 114 Figure 51 Worm plots of z-scores for Model 3 for weight-for-age for girls 115 Figure 52 3rd,10th,50th,90th,97th smoothed centile curves and empirical values: weight-for-age for girls from birth to 24 months 118 Figure 53 5th,25th,50th,75th,95th smoothed centile curves and empirical values: weight-for-age for girls from birth to 24 months 119 viii
viii Figure 27 WHO length-for-age percentiles for girls from birth to 24 months 62 Figure 28 WHO height-for-age percentiles for girls from 24 to 60 months 63 Figure 29 Comparison of WHO with NCHS length/height-for-age z-scores for girls 72 Figure 30 Comparison of WHO with CDC 2000 length/height-for-age z-scores for girls 73 Figure 31 Comparison of boys' and girls' WHO length/height-for-age z-scores 75 Figure 32 Comparison of boys' and girls' NCHS length/height-for-age z-scores 76 Figure 33 Comparison of boys' and girls' CDC 2000 length/height-for-age z-scores 77 Figure 34 Worm plots of z-scores for Model 1 for weight-for-age for boys 81 Figure 35 Fitting of the µ, σ, and ν curves of Model 2 for weight-for-age for boys from 0 to 71 months (dotted line) and their respective sample estimates (points with solid line) 84 Figure 36 Centile residuals from fitting Model 2 for weight-for-age from 0 to 24 months for boys 85 Figure 37 Centile residuals from fitting Model 2 for weight-for-age from 24 to 71 months for boys 85 Figure 38 Worm plots of z-scores for Model 2 for weight-for-age for boys 86 Figure 39 3rd, 10th, 50th, 90th, 97th smoothed centile curves and empirical values: weight-for-age for boys from birth to 24 months 90 Figure 40 5th, 25th, 50th, 75th, 95th smoothed centile curves and empirical values: weight-for-age for boys from birth to 24 months 91 Figure 41 3rd, 10th, 50th, 90th, 97th smoothed centile curves and empirical values: weight-for-age for boys from 24 to 71 months 92 Figure 42 5th, 25th, 50th, 75th, 95th smoothed centile curves and empirical values: weight-for-age for boys from 24 to 71 months 93 Figure 43 WHO weight-for-age z-scores for boys from birth to 60 months 95 Figure 44 WHO weight-for-age percentiles for boys from birth to 60 months 96 Figure 45 Comparison of WHO with NCHS weight-for-age z-scores for boys 105 Figure 46 Comparison of WHO with CDC 2000 weight-for-age z-scores for boys 106 Figure 47 Cubic splines fitted for the ν curve with varying numbers of degrees of freedom 110 Figure 48 Fitting of the µ, σ, and ν curves of Model 3 for weight-for-age for girls from 0 to 71 months (dotted line) and their respective sample estimates (points with solid line) 113 Figure 49 Centile residuals from fitting Model 3 for weight-for-age from 0 to 24 months for girls 114 Figure 50 Centile residuals from fitting Model 3 for weight-for-age from 24 to 71 months for girls 114 Figure 51 Worm plots of z-scores for Model 3 for weight-for-age for girls 115 Figure 52 3rd, 10th, 50th, 90th, 97th smoothed centile curves and empirical values: weight-for-age for girls from birth to 24 months 118 Figure 53 5th, 25th, 50th, 75th, 95th smoothed centile curves and empirical values: weight-for-age for girls from birth to 24 months 119