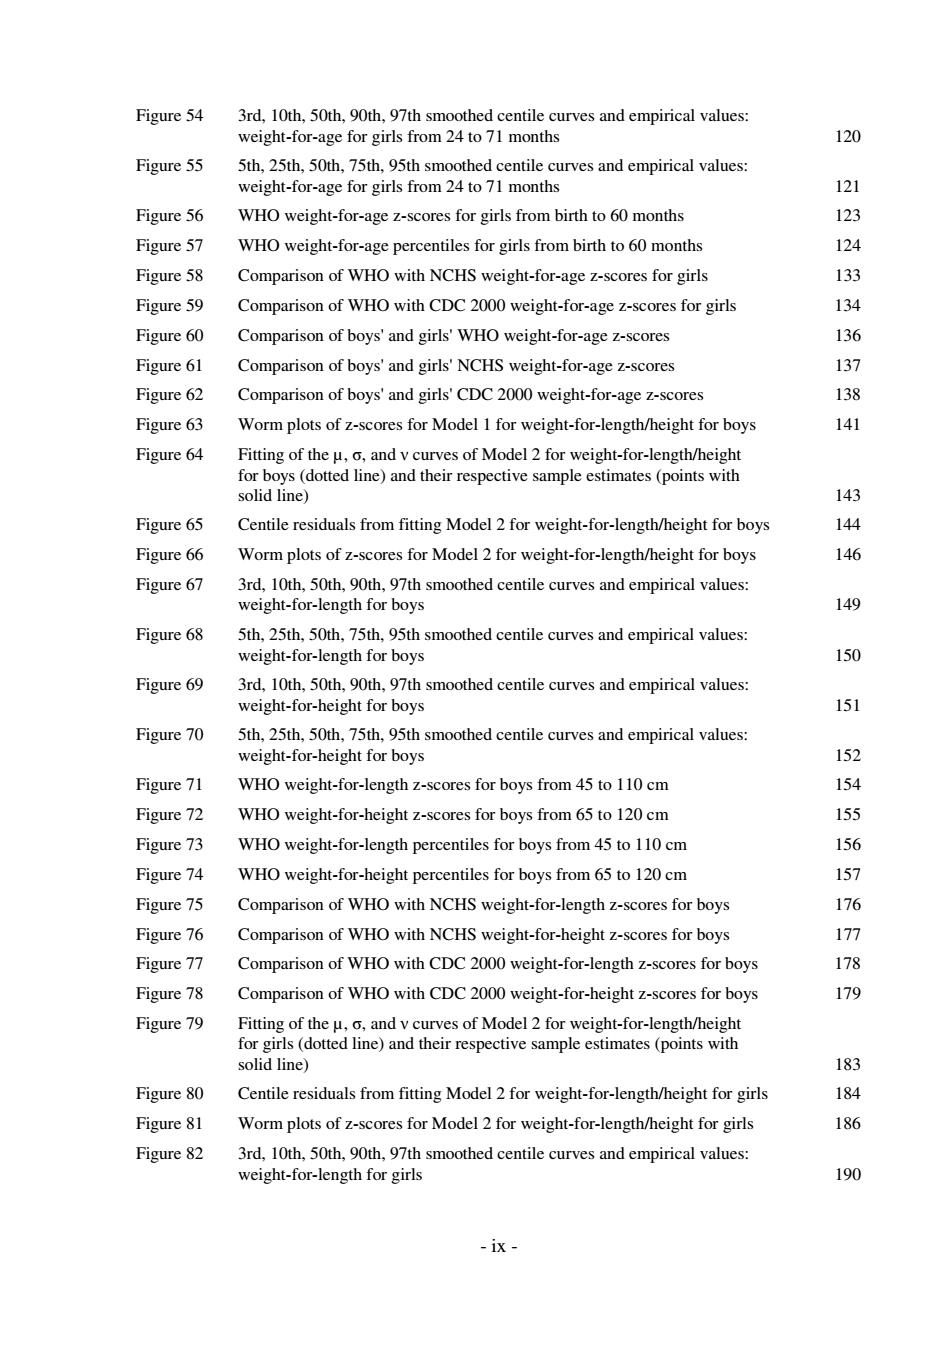
Figure 54 3rd,10th,50th,90th,97th smoothed centile curves and empirical values: weight-for-age for girls from 24 to 71 months 120 Figure 55 5th,25th,50th,75th,95th smoothed centile curves and empirical values: weight-for-age for girls from 24 to 71 months 121 Figure 56 WHO weight-for-age z-scores for girls from birth to 60 months 123 Figure 57 WHO weight-for-age percentiles for girls from birth to 60 months 124 Figure 58 Comparison of WHO with NCHS weight-for-age z-scores for girls 133 Figure 59 Comparison of WHO with CDC 2000 weight-for-age z-scores for girls 134 Figure 60 Comparison of boys'and girls'WHO weight-for-age z-scores 136 Figure 61 Comparison of boys'and girls'NCHS weight-for-age z-scores 137 Figure 62 Comparison of boys'and girls'CDC 2000 weight-for-age z-scores 138 Figure 63 Worm plots of z-scores for Model 1 for weight-for-length/height for boys 141 Figure 64 Fitting of the u,o,and v curves of Model 2 for weight-for-length/height for boys (dotted line)and their respective sample estimates(points with solid line) 143 Figure 65 Centile residuals from fitting Model 2 for weight-for-length/height for boys 144 Figure 66 Worm plots of z-scores for Model 2 for weight-for-length/height for boys 146 Figure 67 3rd,10th,50th,90th,97th smoothed centile curves and empirical values: weight-for-length for boys 149 Figure 68 5th.25th.50th.75th.95th smoothed centile curves and empirical values: weight-for-length for boys 150 Figure 69 3rd,10th,50th,90th,97th smoothed centile curves and empirical values: weight-for-height for boys 151 Figure 70 5th,25th,50th,75th,95th smoothed centile curves and empirical values: weight-for-height for boys 152 Figure 71 WHO weight-for-length z-scores for boys from 45 to 110 cm 154 Figure 72 WHO weight-for-height z-scores for boys from 65 to 120 cm 155 Figure 73 WHO weight-for-length percentiles for boys from 45 to 110 cm 156 Figure 74 WHO weight-for-height percentiles for boys from 65 to 120 cm 157 Figure 75 Comparison of WHO with NCHS weight-for-length z-scores for boys 176 Figure 76 Comparison of WHO with NCHS weight-for-height z-scores for boys 177 Figure 77 Comparison of WHO with CDC 2000 weight-for-length z-scores for boys 178 Figure 78 Comparison of WHO with CDC 2000 weight-for-height z-scores for boys 179 Figure 79 Fitting of the u,o,and v curves of Model 2 for weight-for-length/height for girls(dotted line)and their respective sample estimates(points with solid line) 183 Figure 80 Centile residuals from fitting Model 2 for weight-for-length/height for girls 184 Figure 81 Worm plots of z-scores for Model 2 for weight-for-length/height for girls 186 Figure 82 3rd,10th,50th,90th,97th smoothed centile curves and empirical values: weight-for-length for girls 190 -1x-
- ix - Figure 54 3rd, 10th, 50th, 90th, 97th smoothed centile curves and empirical values: weight-for-age for girls from 24 to 71 months 120 Figure 55 5th, 25th, 50th, 75th, 95th smoothed centile curves and empirical values: weight-for-age for girls from 24 to 71 months 121 Figure 56 WHO weight-for-age z-scores for girls from birth to 60 months 123 Figure 57 WHO weight-for-age percentiles for girls from birth to 60 months 124 Figure 58 Comparison of WHO with NCHS weight-for-age z-scores for girls 133 Figure 59 Comparison of WHO with CDC 2000 weight-for-age z-scores for girls 134 Figure 60 Comparison of boys' and girls' WHO weight-for-age z-scores 136 Figure 61 Comparison of boys' and girls' NCHS weight-for-age z-scores 137 Figure 62 Comparison of boys' and girls' CDC 2000 weight-for-age z-scores 138 Figure 63 Worm plots of z-scores for Model 1 for weight-for-length/height for boys 141 Figure 64 Fitting of the µ, σ, and ν curves of Model 2 for weight-for-length/height for boys (dotted line) and their respective sample estimates (points with solid line) 143 Figure 65 Centile residuals from fitting Model 2 for weight-for-length/height for boys 144 Figure 66 Worm plots of z-scores for Model 2 for weight-for-length/height for boys 146 Figure 67 3rd, 10th, 50th, 90th, 97th smoothed centile curves and empirical values: weight-for-length for boys 149 Figure 68 5th, 25th, 50th, 75th, 95th smoothed centile curves and empirical values: weight-for-length for boys 150 Figure 69 3rd, 10th, 50th, 90th, 97th smoothed centile curves and empirical values: weight-for-height for boys 151 Figure 70 5th, 25th, 50th, 75th, 95th smoothed centile curves and empirical values: weight-for-height for boys 152 Figure 71 WHO weight-for-length z-scores for boys from 45 to 110 cm 154 Figure 72 WHO weight-for-height z-scores for boys from 65 to 120 cm 155 Figure 73 WHO weight-for-length percentiles for boys from 45 to 110 cm 156 Figure 74 WHO weight-for-height percentiles for boys from 65 to 120 cm 157 Figure 75 Comparison of WHO with NCHS weight-for-length z-scores for boys 176 Figure 76 Comparison of WHO with NCHS weight-for-height z-scores for boys 177 Figure 77 Comparison of WHO with CDC 2000 weight-for-length z-scores for boys 178 Figure 78 Comparison of WHO with CDC 2000 weight-for-height z-scores for boys 179 Figure 79 Fitting of the µ, σ, and ν curves of Model 2 for weight-for-length/height for girls (dotted line) and their respective sample estimates (points with solid line) 183 Figure 80 Centile residuals from fitting Model 2 for weight-for-length/height for girls 184 Figure 81 Worm plots of z-scores for Model 2 for weight-for-length/height for girls 186 Figure 82 3rd, 10th, 50th, 90th, 97th smoothed centile curves and empirical values: weight-for-length for girls 190
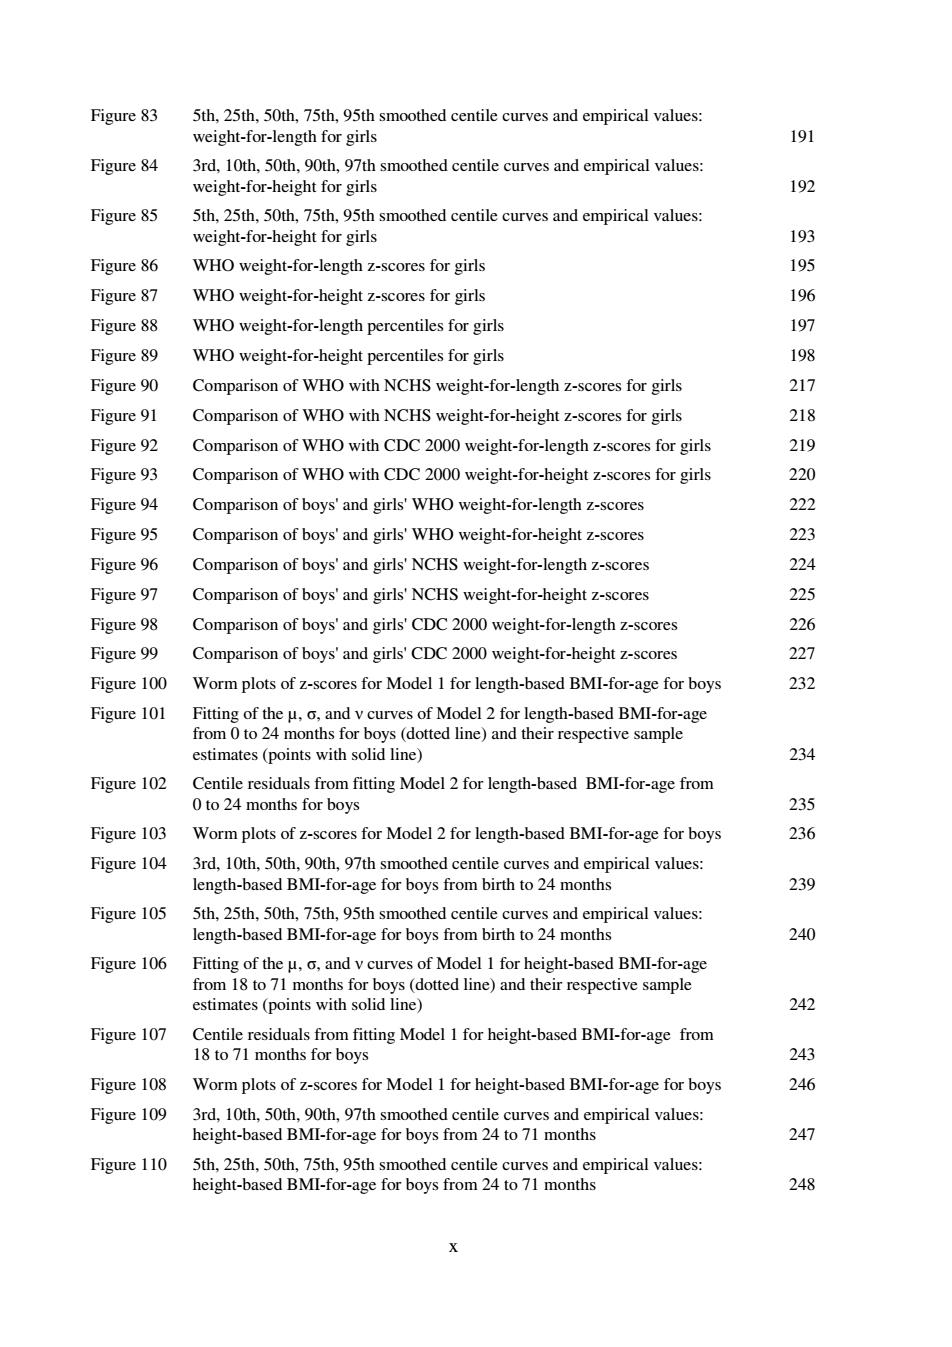
Figure 83 5th,25th,50th,75th,95th smoothed centile curves and empirical values: weight-for-length for girls 191 Figure 84 3rd,10th,50th,90th,97th smoothed centile curves and empirical values: weight-for-height for girls 192 Figure 85 5th,25th,50th,75th,95th smoothed centile curves and empirical values: weight-for-height for girls 193 Figure 86 WHO weight-for-length z-scores for girls 195 Figure 87 WHO weight-for-height z-scores for girls 196 Figure 88 WHO weight-for-length percentiles for girls 197 Figure 89 WHO weight-for-height percentiles for girls 198 Figure 90 Comparison of WHO with NCHS weight-for-length z-scores for girls 217 Figure 91 Comparison of WHO with NCHS weight-for-height z-scores for girls 218 Figure 92 Comparison of WHO with CDC 2000 weight-for-length z-scores for girls 219 Figure 93 Comparison of WHO with CDC 2000 weight-for-height z-scores for girls 220 Figure 94 Comparison of boys'and girls'WHO weight-for-length z-scores 222 Figure 95 Comparison of boys'and girls'WHO weight-for-height z-scores 223 Figure 96 Comparison of boys'and girls'NCHS weight-for-length z-scores 224 Figure 97 Comparison of boys'and girls'NCHS weight-for-height z-scores 225 Figure 98 Comparison of boys'and girls'CDC 2000 weight-for-length z-scores 226 Figure 99 Comparison of boys'and girls'CDC 2000 weight-for-height z-scores 227 Figure 100 Worm plots of z-scores for Model 1 for length-based BMI-for-age for boys 232 Figure 101 Fitting of the u,o,and v curves of Model 2 for length-based BMI-for-age from 0 to 24 months for boys(dotted line)and their respective sample estimates (points with solid line) 234 Figure 102 Centile residuals from fitting Model 2 for length-based BMI-for-age from 0 to 24 months for boys 235 Figure 103 Worm plots of z-scores for Model 2 for length-based BMI-for-age for boys 236 Figure 104 3rd,10th,50th,90th,97th smoothed centile curves and empirical values: length-based BMI-for-age for boys from birth to 24 months 239 Figure 105 5th,25th,50th,75th,95th smoothed centile curves and empirical values: length-based BMI-for-age for boys from birth to 24 months 240 Figure 106 Fitting of the u,o,and v curves of Model 1 for height-based BMI-for-age from 18 to 71 months for boys(dotted line)and their respective sample estimates (points with solid line) 242 Figure 107 Centile residuals from fitting Model 1 for height-based BMI-for-age from 18 to 71 months for boys 243 Figure 108 Worm plots of z-scores for Model 1 for height-based BMI-for-age for boys 246 Figure 109 3rd,10th,50th,90th,97th smoothed centile curves and empirical values: height-based BMI-for-age for boys from 24 to 71 months 247 Figure 110 5th,25th,50th,75th,95th smoothed centile curves and empirical values: height-based BMI-for-age for boys from 24 to 71 months 248
x Figure 83 5th, 25th, 50th, 75th, 95th smoothed centile curves and empirical values: weight-for-length for girls 191 Figure 84 3rd, 10th, 50th, 90th, 97th smoothed centile curves and empirical values: weight-for-height for girls 192 Figure 85 5th, 25th, 50th, 75th, 95th smoothed centile curves and empirical values: weight-for-height for girls 193 Figure 86 WHO weight-for-length z-scores for girls 195 Figure 87 WHO weight-for-height z-scores for girls 196 Figure 88 WHO weight-for-length percentiles for girls 197 Figure 89 WHO weight-for-height percentiles for girls 198 Figure 90 Comparison of WHO with NCHS weight-for-length z-scores for girls 217 Figure 91 Comparison of WHO with NCHS weight-for-height z-scores for girls 218 Figure 92 Comparison of WHO with CDC 2000 weight-for-length z-scores for girls 219 Figure 93 Comparison of WHO with CDC 2000 weight-for-height z-scores for girls 220 Figure 94 Comparison of boys' and girls' WHO weight-for-length z-scores 222 Figure 95 Comparison of boys' and girls' WHO weight-for-height z-scores 223 Figure 96 Comparison of boys' and girls' NCHS weight-for-length z-scores 224 Figure 97 Comparison of boys' and girls' NCHS weight-for-height z-scores 225 Figure 98 Comparison of boys' and girls' CDC 2000 weight-for-length z-scores 226 Figure 99 Comparison of boys' and girls' CDC 2000 weight-for-height z-scores 227 Figure 100 Worm plots of z-scores for Model 1 for length-based BMI-for-age for boys 232 Figure 101 Fitting of the µ, σ, and ν curves of Model 2 for length-based BMI-for-age from 0 to 24 months for boys (dotted line) and their respective sample estimates (points with solid line) 234 Figure 102 Centile residuals from fitting Model 2 for length-based BMI-for-age from 0 to 24 months for boys 235 Figure 103 Worm plots of z-scores for Model 2 for length-based BMI-for-age for boys 236 Figure 104 3rd, 10th, 50th, 90th, 97th smoothed centile curves and empirical values: length-based BMI-for-age for boys from birth to 24 months 239 Figure 105 5th, 25th, 50th, 75th, 95th smoothed centile curves and empirical values: length-based BMI-for-age for boys from birth to 24 months 240 Figure 106 Fitting of the µ, σ, and ν curves of Model 1 for height-based BMI-for-age from 18 to 71 months for boys (dotted line) and their respective sample estimates (points with solid line) 242 Figure 107 Centile residuals from fitting Model 1 for height-based BMI-for-age from 18 to 71 months for boys 243 Figure 108 Worm plots of z-scores for Model 1 for height-based BMI-for-age for boys 246 Figure 109 3rd, 10th, 50th, 90th, 97th smoothed centile curves and empirical values: height-based BMI-for-age for boys from 24 to 71 months 247 Figure 110 5th, 25th, 50th, 75th, 95th smoothed centile curves and empirical values: height-based BMI-for-age for boys from 24 to 71 months 248
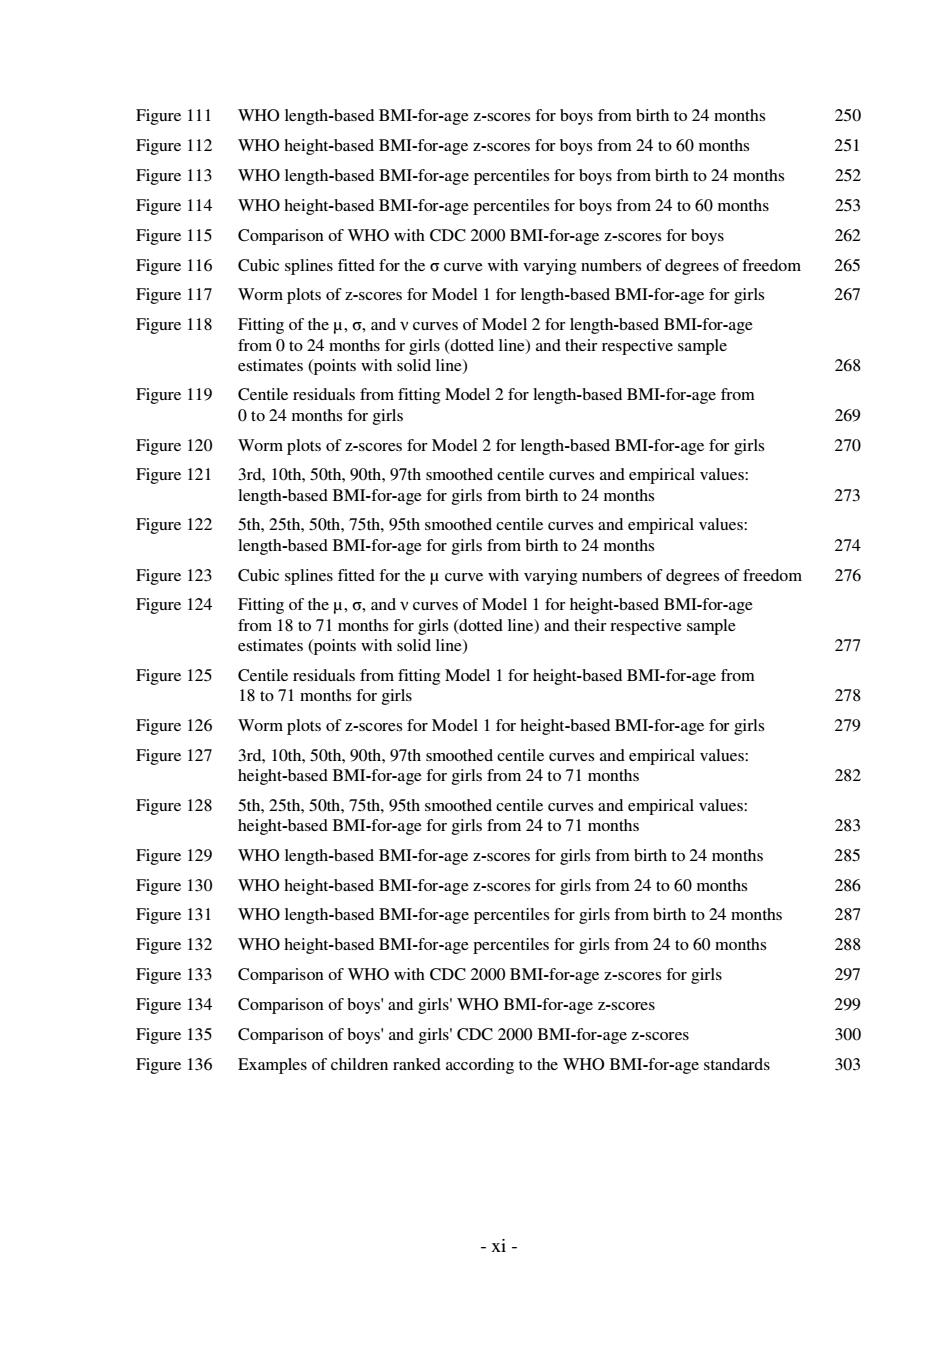
Figure 111 WHO length-based BMI-for-age z-scores for boys from birth to 24 months 250 Figure 112 WHO height-based BMI-for-age z-scores for boys from 24 to 60 months 251 Figure 113 WHO length-based BMI-for-age percentiles for boys from birth to 24 months 252 Figure 114 WHO height-based BMI-for-age percentiles for boys from 24 to 60 months 253 Figure 115 Comparison of WHO with CDC 2000 BMI-for-age z-scores for boys 262 Figure 116 Cubic splines fitted for the o curve with varying numbers of degrees of freedom 265 Figure 117 Worm plots of z-scores for Model 1 for length-based BMI-for-age for girls 267 Figure 118 Fitting of the u,o,and v curves of Model 2 for length-based BMI-for-age from 0 to 24 months for girls(dotted line)and their respective sample estimates (points with solid line) 268 Figure 119 Centile residuals from fitting Model 2 for length-based BMI-for-age from 0 to 24 months for girls 269 Figure 120 Worm plots of z-scores for Model 2 for length-based BMI-for-age for girls 270 Figure 121 3rd,10th,50th,90th,97th smoothed centile curves and empirical values: length-based BMI-for-age for girls from birth to 24 months 273 Figure 122 5th,25th,50th,75th,95th smoothed centile curves and empirical values: length-based BMI-for-age for girls from birth to 24 months 274 Figure 123 Cubic splines fitted for the u curve with varying numbers of degrees of freedom 276 Figure 124 Fitting of the u,o,and v curves of Model 1 for height-based BMI-for-age from 18 to 71 months for girls(dotted line)and their respective sample estimates(points with solid line) 277 Figure 125 Centile residuals from fitting Model 1 for height-based BMI-for-age from 18 to 71 months for girls 278 Figure 126 Worm plots of z-scores for Model 1 for height-based BMI-for-age for girls 279 Figure 127 3rd,10th,50th,90th,97th smoothed centile curves and empirical values: height-based BMI-for-age for girls from 24 to 71 months 282 Figure 128 5th,25th,50th,75th,95th smoothed centile curves and empirical values: height-based BMI-for-age for girls from 24 to 71 months 283 Figure 129 WHO length-based BMI-for-age z-scores for girls from birth to 24 months 285 Figure 130 WHO height-based BMI-for-age z-scores for girls from 24 to 60 months 286 Figure 131 WHO length-based BMI-for-age percentiles for girls from birth to 24 months 287 Figure 132 WHO height-based BMI-for-age percentiles for girls from 24 to 60 months 288 Figure 133 Comparison of WHO with CDC 2000 BMI-for-age z-scores for girls 297 Figure 134 Comparison of boys'and girls'WHO BMI-for-age z-scores 299 Figure 135 Comparison of boys'and girls'CDC 2000 BMI-for-age z-scores 300 Figure 136 Examples of children ranked according to the WHO BMI-for-age standards 303 -xi-
- xi - Figure 111 WHO length-based BMI-for-age z-scores for boys from birth to 24 months 250 Figure 112 WHO height-based BMI-for-age z-scores for boys from 24 to 60 months 251 Figure 113 WHO length-based BMI-for-age percentiles for boys from birth to 24 months 252 Figure 114 WHO height-based BMI-for-age percentiles for boys from 24 to 60 months 253 Figure 115 Comparison of WHO with CDC 2000 BMI-for-age z-scores for boys 262 Figure 116 Cubic splines fitted for the σ curve with varying numbers of degrees of freedom 265 Figure 117 Worm plots of z-scores for Model 1 for length-based BMI-for-age for girls 267 Figure 118 Fitting of the µ, σ, and ν curves of Model 2 for length-based BMI-for-age from 0 to 24 months for girls (dotted line) and their respective sample estimates (points with solid line) 268 Figure 119 Centile residuals from fitting Model 2 for length-based BMI-for-age from 0 to 24 months for girls 269 Figure 120 Worm plots of z-scores for Model 2 for length-based BMI-for-age for girls 270 Figure 121 3rd, 10th, 50th, 90th, 97th smoothed centile curves and empirical values: length-based BMI-for-age for girls from birth to 24 months 273 Figure 122 5th, 25th, 50th, 75th, 95th smoothed centile curves and empirical values: length-based BMI-for-age for girls from birth to 24 months 274 Figure 123 Cubic splines fitted for the µ curve with varying numbers of degrees of freedom 276 Figure 124 Fitting of the µ, σ, and ν curves of Model 1 for height-based BMI-for-age from 18 to 71 months for girls (dotted line) and their respective sample estimates (points with solid line) 277 Figure 125 Centile residuals from fitting Model 1 for height-based BMI-for-age from 18 to 71 months for girls 278 Figure 126 Worm plots of z-scores for Model 1 for height-based BMI-for-age for girls 279 Figure 127 3rd, 10th, 50th, 90th, 97th smoothed centile curves and empirical values: height-based BMI-for-age for girls from 24 to 71 months 282 Figure 128 5th, 25th, 50th, 75th, 95th smoothed centile curves and empirical values: height-based BMI-for-age for girls from 24 to 71 months 283 Figure 129 WHO length-based BMI-for-age z-scores for girls from birth to 24 months 285 Figure 130 WHO height-based BMI-for-age z-scores for girls from 24 to 60 months 286 Figure 131 WHO length-based BMI-for-age percentiles for girls from birth to 24 months 287 Figure 132 WHO height-based BMI-for-age percentiles for girls from 24 to 60 months 288 Figure 133 Comparison of WHO with CDC 2000 BMI-for-age z-scores for girls 297 Figure 134 Comparison of boys' and girls' WHO BMI-for-age z-scores 299 Figure 135 Comparison of boys' and girls' CDC 2000 BMI-for-age z-scores 300 Figure 136 Examples of children ranked according to the WHO BMI-for-age standards 303
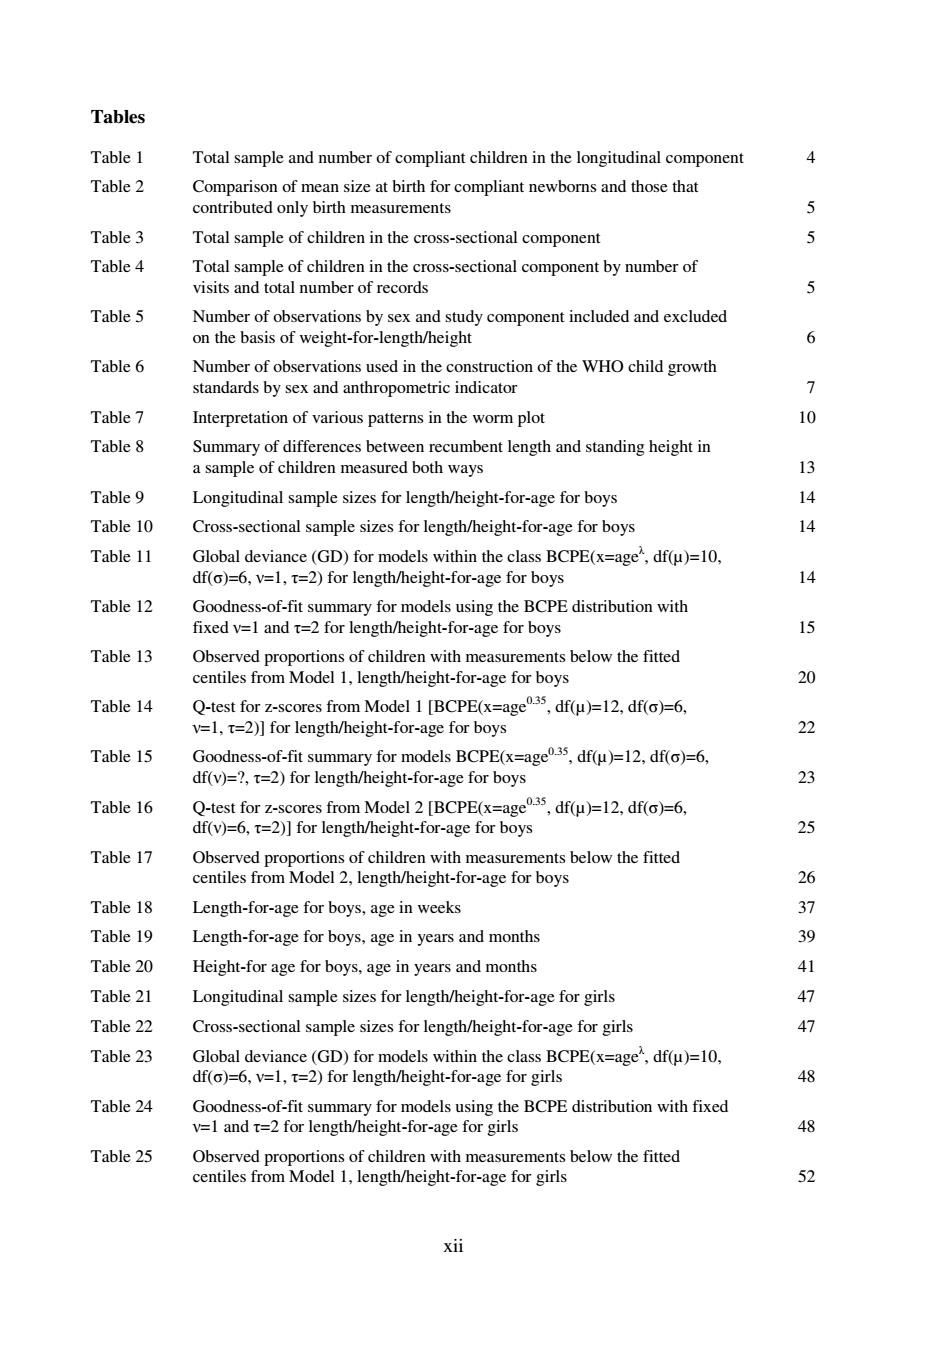
Tables Table 1 Total sample and number of compliant children in the longitudinal component Table 2 Comparison of mean size at birth for compliant newborns and those that contributed only birth measurements Table 3 Total sample of children in the cross-sectional component 5 Table 4 Total sample of children in the cross-sectional component by number of visits and total number of records Table 5 Number of observations by sex and study component included and excluded on the basis of weight-for-length/height 6 Table 6 Number of observations used in the construction of the WHO child growth standards by sex and anthropometric indicator 7 Table 7 Interpretation of various patterns in the worm plot Table 8 Summary of differences between recumbent length and standing height in a sample of children measured both ways 13 Table 9 Longitudinal sample sizes for length/height-for-age for boys 14 Table 10 Cross-sectional sample sizes for length/height-for-age for boys 14 Table 11 Global deviance(GD)for models within the class BCPE(x=age",df(u)=10, df(o)=6,v=1,t=2)for length/height-for-age for boys 14 Table 12 Goodness-of-fit summary for models using the BCPE distribution with fixed v=1 and t=2 for length/height-for-age for boys 15 Table 13 Observed proportions of children with measurements below the fitted centiles from Model 1,length/height-for-age for boys 20 Table 14 Q-test for z-scores from Model 1 [BCPE(x=age5,df(u)=12,df()=6. v=1,t=2)]for length/height-for-age for boys 22 Table 15 Goodness-of-fit summary for models BCPE(x=age35,df(u)=12,df(o)=6, df(v)=?,t=2)for length/height-for-age for boys 23 Table 16 Q-test for z-scores from Model 2 [BCPE(x=age5,df()=12.df()=6, df(v)=6,t=2)]for length/height-for-age for boys 25 Table 17 Observed proportions of children with measurements below the fitted centiles from Model 2,length/height-for-age for boys 26 Table 18 Length-for-age for boys,age in weeks 37 Table 19 Length-for-age for boys,age in years and months 39 Table 20 Height-for age for boys,age in years and months 41 Table 21 Longitudinal sample sizes for length/height-for-age for girls 47 Table 22 Cross-sectional sample sizes for length/height-for-age for girls 47 Table 23 Global deviance(GD)for models within the class BCPE(x=age",df(u)=10, df(o)=6,v=1,t=2)for length/height-for-age for girls 48 Table 24 Goodness-of-fit summary for models using the BCPE distribution with fixed v=1 and t=2 for length/height-for-age for girls 48 Table 25 Observed proportions of children with measurements below the fitted centiles from Model 1,length/height-for-age for girls 52 xii
xii Tables Table 1 Total sample and number of compliant children in the longitudinal component 4 Table 2 Comparison of mean size at birth for compliant newborns and those that contributed only birth measurements 5 Table 3 Total sample of children in the cross-sectional component 5 Table 4 Total sample of children in the cross-sectional component by number of visits and total number of records 5 Table 5 Number of observations by sex and study component included and excluded on the basis of weight-for-length/height 6 Table 6 Number of observations used in the construction of the WHO child growth standards by sex and anthropometric indicator 7 Table 7 Interpretation of various patterns in the worm plot 10 Table 8 Summary of differences between recumbent length and standing height in a sample of children measured both ways 13 Table 9 Longitudinal sample sizes for length/height-for-age for boys 14 Table 10 Cross-sectional sample sizes for length/height-for-age for boys 14 Table 11 Global deviance (GD) for models within the class BCPE(x=ageλ , df(µ)=10, df(σ)=6, ν=1, τ=2) for length/height-for-age for boys 14 Table 12 Goodness-of-fit summary for models using the BCPE distribution with fixed ν=1 and τ=2 for length/height-for-age for boys 15 Table 13 Observed proportions of children with measurements below the fitted centiles from Model 1, length/height-for-age for boys 20 Table 14 Q-test for z-scores from Model 1 [BCPE(x=age0.35, df(µ)=12, df(σ)=6, ν=1, τ=2)] for length/height-for-age for boys 22 Table 15 Goodness-of-fit summary for models BCPE(x=age0.35, df(µ)=12, df(σ)=6, df(ν)=?, τ=2) for length/height-for-age for boys 23 Table 16 Q-test for z-scores from Model 2 [BCPE(x=age0.35, df(µ)=12, df(σ)=6, df(ν)=6, τ=2)] for length/height-for-age for boys 25 Table 17 Observed proportions of children with measurements below the fitted centiles from Model 2, length/height-for-age for boys 26 Table 18 Length-for-age for boys, age in weeks 37 Table 19 Length-for-age for boys, age in years and months 39 Table 20 Height-for age for boys, age in years and months 41 Table 21 Longitudinal sample sizes for length/height-for-age for girls 47 Table 22 Cross-sectional sample sizes for length/height-for-age for girls 47 Table 23 Global deviance (GD) for models within the class BCPE(x=ageλ , df(µ)=10, df(σ)=6, ν=1, τ=2) for length/height-for-age for girls 48 Table 24 Goodness-of-fit summary for models using the BCPE distribution with fixed ν=1 and τ=2 for length/height-for-age for girls 48 Table 25 Observed proportions of children with measurements below the fitted centiles from Model 1, length/height-for-age for girls 52
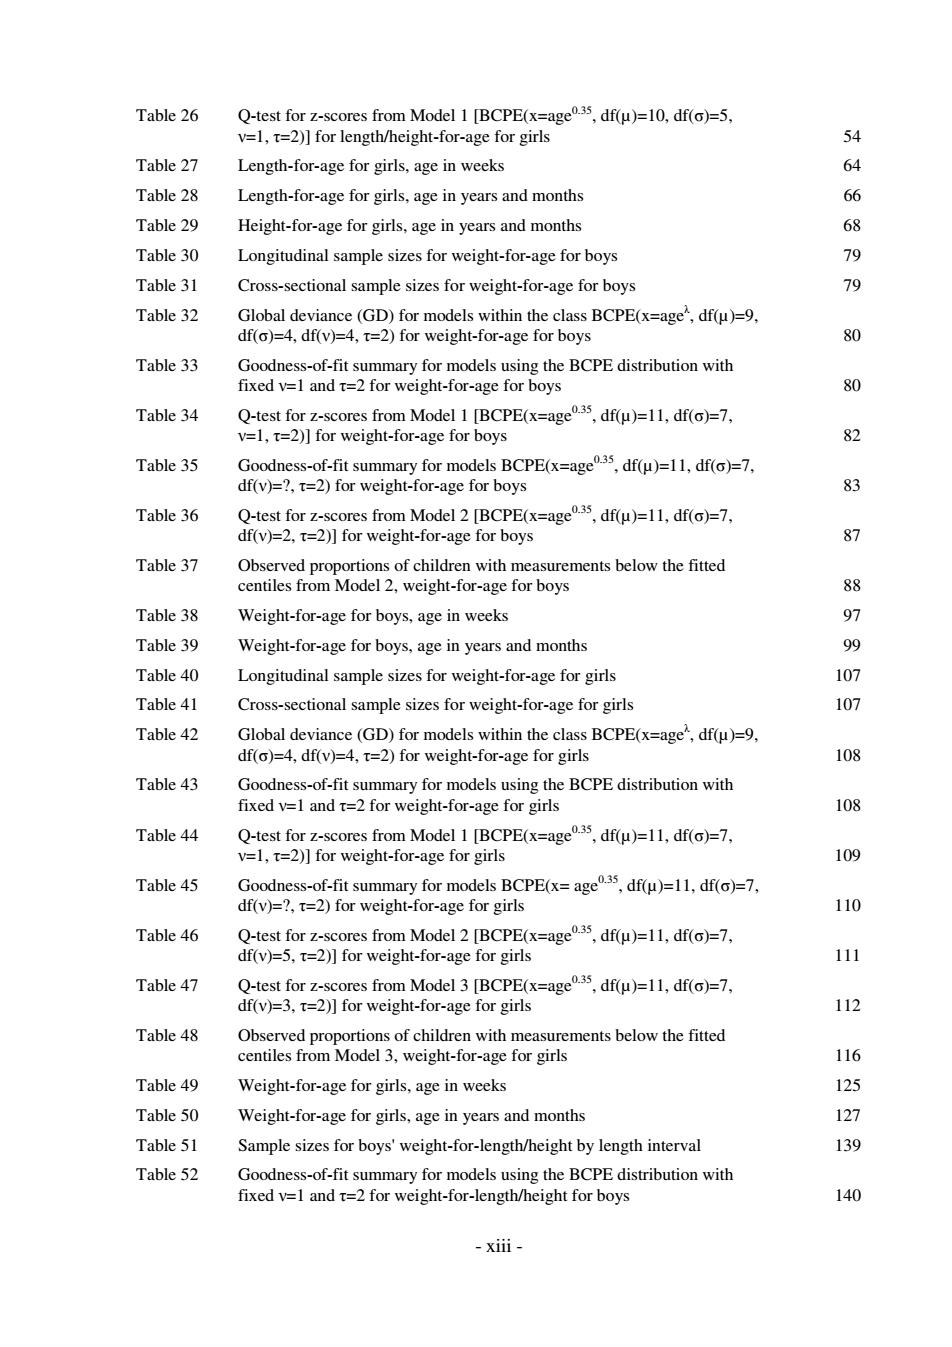
Table 26 Q-test for z-scores from Model 1 [BCPE(x=age3,df(u)=10,df()=5, v=1,t=2)]for length/height-for-age for girls 54 Table 27 Length-for-age for girls,age in weeks 64 Table 28 Length-for-age for girls,age in years and months 66 Table 29 Height-for-age for girls,age in years and months 68 Table 30 Longitudinal sample sizes for weight-for-age for boys 79 Table 31 Cross-sectional sample sizes for weight-for-age for boys 79 Table 32 Global deviance(GD)for models within the class BCPE(x:=age,dfμ))=9, df(o)=4,df(v)=4,t=2)for weight-for-age for boys 80 Table 33 Goodness-of-fit summary for models using the BCPE distribution with fixed v=1 and t=2 for weight-for-age for boys 80 Table 34 Q-test for z-scores from Model 1 [BCPE(x=age5,df(u)=11,df()=7, v=1,t=2)]for weight-for-age for boys 82 Table 35 Goodness-of-fit summary for models BCPE(x=age35,df(u)=11,df()=7, df(v)=?,t=2)for weight-for-age for boys 83 Table 36 Q-test for z-scores from Model 2 [BCPE(x=age35,df(u)=11,df()=7, df(v)=2,t=2)]for weight-for-age for boys 87 Table 37 Observed proportions of children with measurements below the fitted centiles from Model 2,weight-for-age for boys 88 Table 38 Weight-for-age for boys,age in weeks 97 Table 39 Weight-for-age for boys,age in years and months 99 Table 40 Longitudinal sample sizes for weight-for-age for girls 107 Table 41 Cross-sectional sample sizes for weight-for-age for girls 107 Table 42 Global deviance(GD)for models within the class BCPE(x=age,df(u)=9, df(o)=4,df(v)=4,t=2)for weight-for-age for girls 108 Table 43 Goodness-of-fit summary for models using the BCPE distribution with fixed v=1 and t=2 for weight-for-age for girls 108 Table 44 Q-test for z-scores from Model 1 [BCPE(x=age35,df(u)=11,df()=7, v=1,t=2)]for weight-for-age for girls 109 Table 45 Goodness-of-fit summary for models BCPE(x=age35,df(u)=11,df()=7, df(v)=?,t=2)for weight-for-age for girls 110 Table 46 Q-test for z-scores from Model 2 [BCPE(x=agedf()=11,df()=7. df(v)=5,t=2)]for weight-for-age for girls 111 Table 47 Q-test for z-scores from Model3 [BCPE(x=age5,df(u)=11,df()=7, df(v)=3,t=2)]for weight-for-age for girls 112 Table 48 Observed proportions of children with measurements below the fitted centiles from Model 3,weight-for-age for girls 116 Table 49 Weight-for-age for girls,age in weeks 125 Table 50 Weight-for-age for girls,age in years and months 127 Table 51 Sample sizes for boys'weight-for-length/height by length interval 139 Table 52 Goodness-of-fit summary for models using the BCPE distribution with fixed v=1 and t=2 for weight-for-length/height for boys 140 -xiii-
- xiii - Table 26 Q-test for z-scores from Model 1 [BCPE(x=age0.35, df(µ)=10, df(σ)=5, ν=1, τ=2)] for length/height-for-age for girls 54 Table 27 Length-for-age for girls, age in weeks 64 Table 28 Length-for-age for girls, age in years and months 66 Table 29 Height-for-age for girls, age in years and months 68 Table 30 Longitudinal sample sizes for weight-for-age for boys 79 Table 31 Cross-sectional sample sizes for weight-for-age for boys 79 Table 32 Global deviance (GD) for models within the class BCPE(x=ageλ , df(µ)=9, df(σ)=4, df(ν)=4, τ=2) for weight-for-age for boys 80 Table 33 Goodness-of-fit summary for models using the BCPE distribution with fixed ν=1 and τ=2 for weight-for-age for boys 80 Table 34 Q-test for z-scores from Model 1 [BCPE(x=age0.35, df(µ)=11, df(σ)=7, ν=1, τ=2)] for weight-for-age for boys 82 Table 35 Goodness-of-fit summary for models BCPE(x=age0.35, df(µ)=11, df(σ)=7, df(ν)=?, τ=2) for weight-for-age for boys 83 Table 36 Q-test for z-scores from Model 2 [BCPE(x=age0.35, df(µ)=11, df(σ)=7, df(ν)=2, τ=2)] for weight-for-age for boys 87 Table 37 Observed proportions of children with measurements below the fitted centiles from Model 2, weight-for-age for boys 88 Table 38 Weight-for-age for boys, age in weeks 97 Table 39 Weight-for-age for boys, age in years and months 99 Table 40 Longitudinal sample sizes for weight-for-age for girls 107 Table 41 Cross-sectional sample sizes for weight-for-age for girls 107 Table 42 Global deviance (GD) for models within the class BCPE(x=ageλ , df(µ)=9, df(σ)=4, df(ν)=4, τ=2) for weight-for-age for girls 108 Table 43 Goodness-of-fit summary for models using the BCPE distribution with fixed ν=1 and τ=2 for weight-for-age for girls 108 Table 44 Q-test for z-scores from Model 1 [BCPE(x=age0.35, df(µ)=11, df(σ)=7, ν=1, τ=2)] for weight-for-age for girls 109 Table 45 Goodness-of-fit summary for models BCPE(x= age0.35, df(µ)=11, df(σ)=7, df(ν)=?, τ=2) for weight-for-age for girls 110 Table 46 Q-test for z-scores from Model 2 [BCPE(x=age0.35, df(µ)=11, df(σ)=7, df(ν)=5, τ=2)] for weight-for-age for girls 111 Table 47 Q-test for z-scores from Model 3 [BCPE(x=age0.35, df(µ)=11, df(σ)=7, df(ν)=3, τ=2)] for weight-for-age for girls 112 Table 48 Observed proportions of children with measurements below the fitted centiles from Model 3, weight-for-age for girls 116 Table 49 Weight-for-age for girls, age in weeks 125 Table 50 Weight-for-age for girls, age in years and months 127 Table 51 Sample sizes for boys' weight-for-length/height by length interval 139 Table 52 Goodness-of-fit summary for models using the BCPE distribution with fixed ν=1 and τ=2 for weight-for-length/height for boys 140