It is always a good idea to add comments to your syntax file for the documentation purpose.Use an asterisk (*or the command COMMENT to start your comment text.Remember,all the SPSS commands must end with a period,and that rule applies to comments as well.This is imperative to indicate the end of your comment with a period.Let me show you how so.Run the following bloc of commands.What did you get in your Output Viewer? Descriptives for years of education DESCRIPTIVES VARIABLES=educ /STATISTICS=MEAN STDDEV MIN MAX SKEWNESS. You got nothing,except for the log of the syntax you just ran.Why?Because SPSS treats everything between *(or COMMENT)and the next period as your comment.In this case. "Descriptives for...SKEWNESS."is all treated as a bloc of comment,so DESCRIPTIVES was not executed as a command (..and you are left dumfounded to find no computation results shown in your Output Viewer).So,you always must end your comment with a period. A flip side you can see from this example is that in other words,you can start with or COMMENT and keep commenting over multiple lines till you end it with a period.This may be helpful if you need to add extensive comments to your syntax.So let's fix our syntax. Descriptives for years of education We can comment over multiple lines, A bloc of your comment between an Just don't forget to end it with a period. and a period (".")over multiple lines. DESCRIPTIVES VARIABLES=educ /STATISTICS=MEAN STDDEV /*standard deviation*/MIN MAX SKEWNESS. Notice you have your comment over multiple lines.As you can see,alternatively,you can use/* COMMENT HERE *as well.In this case,*instead of a period indicates the end of your comment.This way comments can be inserted in your command lines. Let's execute this syntax command,including the comment.Select(highlight)the whole syntax command and hit the Run Current button at the top of the Syntax Editor or hit Ctrl+R keys *verybasicspss.SP5-SPSS Syntax Editor ▣x File Edit view Data Transform Analyze Graphs Utilities Run Add-ons Window Help 白日马四的◆国盖民:药 ●g■邑+0 Active:DataSet1、 Run Current Descriptives for years of education Remember we can comment over multiple lines Just don't forget to end it with a period. DESCRIPTIVES VARIABLES=educ /STATISTICS=MEAN STDDEV MIN MAX SKEWNESS. Run current command SPSS Processor is ready In 89 Col 1 See your results displayed in the SPSS Output Viewer. 16
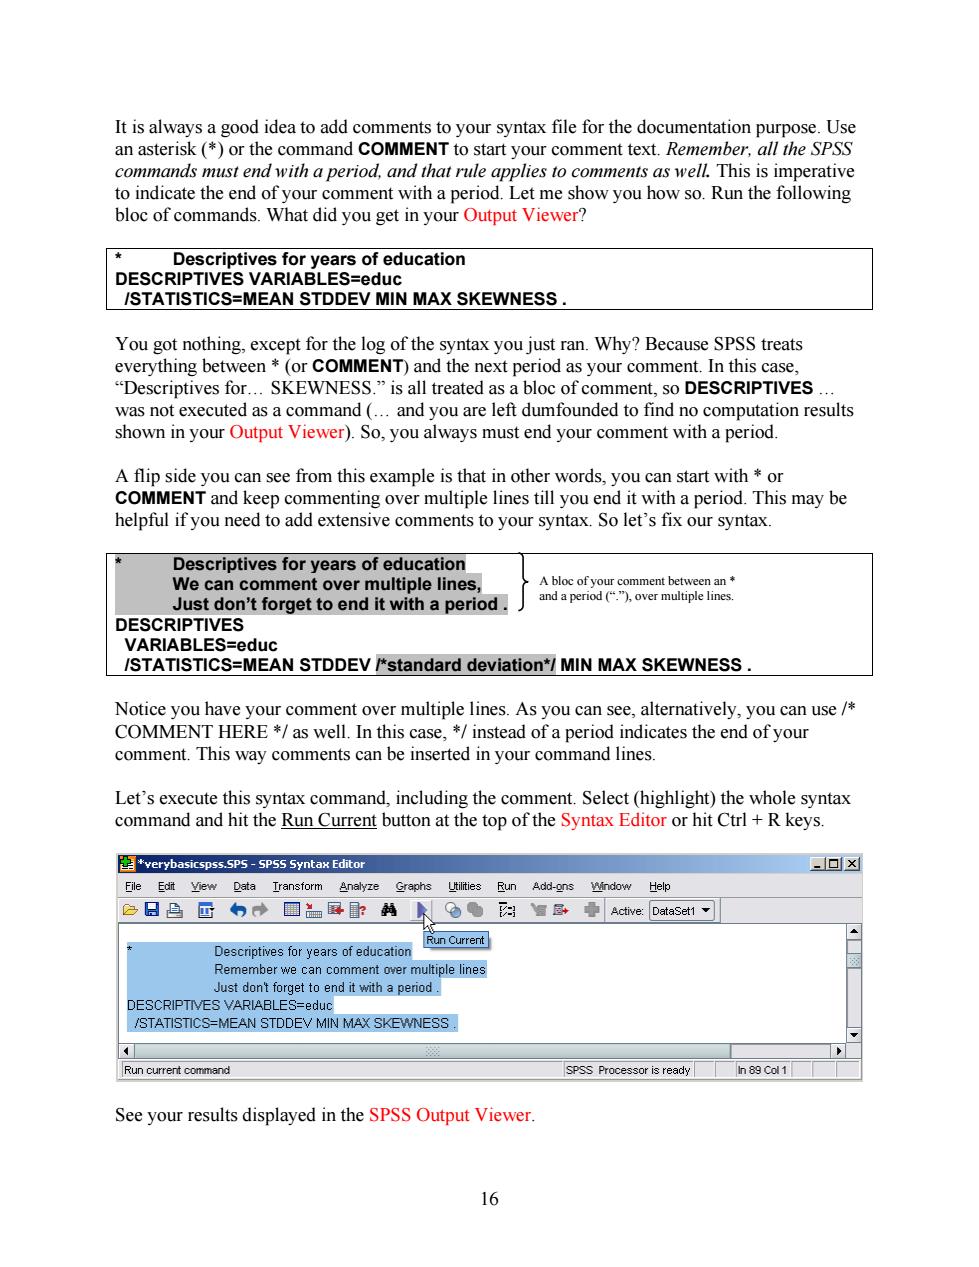
It is always a good idea to add comments to your syntax file for the documentation purpose. Use an asterisk (*) or the command COMMENT to start your comment text. Remember, all the SPSS commands must end with a period, and that rule applies to comments as well. This is imperative to indicate the end of your comment with a period. Let me show you how so. Run the following bloc of commands. What did you get in your Output Viewer? * Descriptives for years of education DESCRIPTIVES VARIABLES=educ /STATISTICS=MEAN STDDEV MIN MAX SKEWNESS . You got nothing, except for the log of the syntax you just ran. Why? Because SPSS treats everything between * (or COMMENT) and the next period as your comment. In this case, “Descriptives for… SKEWNESS.” is all treated as a bloc of comment, so DESCRIPTIVES … was not executed as a command (… and you are left dumfounded to find no computation results shown in your Output Viewer). So, you always must end your comment with a period. A flip side you can see from this example is that in other words, you can start with * or COMMENT and keep commenting over multiple lines till you end it with a period. This may be helpful if you need to add extensive comments to your syntax. So let’s fix our syntax. * Descriptives for years of education We can comment over multiple lines, Just don’t forget to end it with a period . DESCRIPTIVES VARIABLES=educ /STATISTICS=MEAN STDDEV /*standard deviation*/ MIN MAX SKEWNESS . A bloc of your comment between an * and a period (“.”), over multiple lines. Notice you have your comment over multiple lines. As you can see, alternatively, you can use /* COMMENT HERE */ as well. In this case, */ instead of a period indicates the end of your comment. This way comments can be inserted in your command lines. Let’s execute this syntax command, including the comment. Select (highlight) the whole syntax command and hit the Run Current button at the top of the Syntax Editor or hit Ctrl + R keys. See your results displayed in the SPSS Output Viewer. 16
*Output1 [Document1]-SPSS viewer -▣× Ele Edit yiew Dota Ironsform Insert Format Analyze Graphs Litiities Add-gns Wndow Heip 合日凸云的+□卧:合●生吗■画0◆◆一的口员导尊 E▣Output sav!. 伯L0g DATASET NAHE DataSet3 UINDOU=FRONT 白-gUst DATASET ACTIVATE Dataset3. 自Te DATASET CLOSE DataSet1. Notes SAVE OUTF ILE-'D:Documents and+ 自Text Output 'Settings\rumim\Deaktop\Stata\sp1 verybasicsp\sp1 verybasicSp wrktile\verybasicS 色L0g /COHPRESSED. 白目Descriptves DESCRIPTIVES VARIABLES-educ ◆自Tle /STATISTICS-MEAN STDDEV MIN MAX SKEUNESS Notes Active Dataset Descriptive Statisti ◆Descriptives [DataSet3]D: Descriptive Statistics N Minimum Maximum Mean Std.Deviation Skewness Statistic Statistic Statistic Statistic Statistic Statistic Std.Error Highest Year of School 1496 20 13.04 3.074 -309 Completed 063 Valid N (listwise) 1496 SPSS Processor is ready SPSS has in the left pane the output index table.Click any listed index,and SPSS navigates you to the corresponding result objects in the right pane (feel free to try).I highlight the descriptives to bring the corresponding output to my view. Output1 [Document1]-SPSS Viewer =回x Eie Edit Vew Data Iransform Insert Format Analyze Grephs Uilties Add-ons Wndow Hep 合日凸B匠的+回母名●后图细→··0口受票寻 E一回Output 5aV↓。 自L0g DATASET NANE DataSet3 VINDOU=FRONT. 白国Ust DATASET ACTIVATE Datasee3 自Tte DATASET CLOSE Dataset1. 由Notes SAVE OUTFILE-'D:Documents and+ Text Output 'Settings\rumim\Desktop\Stats\ap1_verybasicSP\sp1_verybasicSP_wrkfile\verybasicS 白L0g DESCRIPTIVES VARIABLES-educ Title /STATISTICS-MEAN STDDEV MIN MAX SKEVNESS 马Notes Active Dataset Descriptive Statist Descriptives [DataSet:3】D: Descriptive Statistics N Minimum Maximum Mean Std.Deviation Skewness Statistic Statistic Statistic Statistic Statistic Statistic Std.Error Highest Year of School Comnleted 1496 20 13.04 3.074 -.309 .063 Valid N (listwise) 1496 SPSS Processor is ready 17
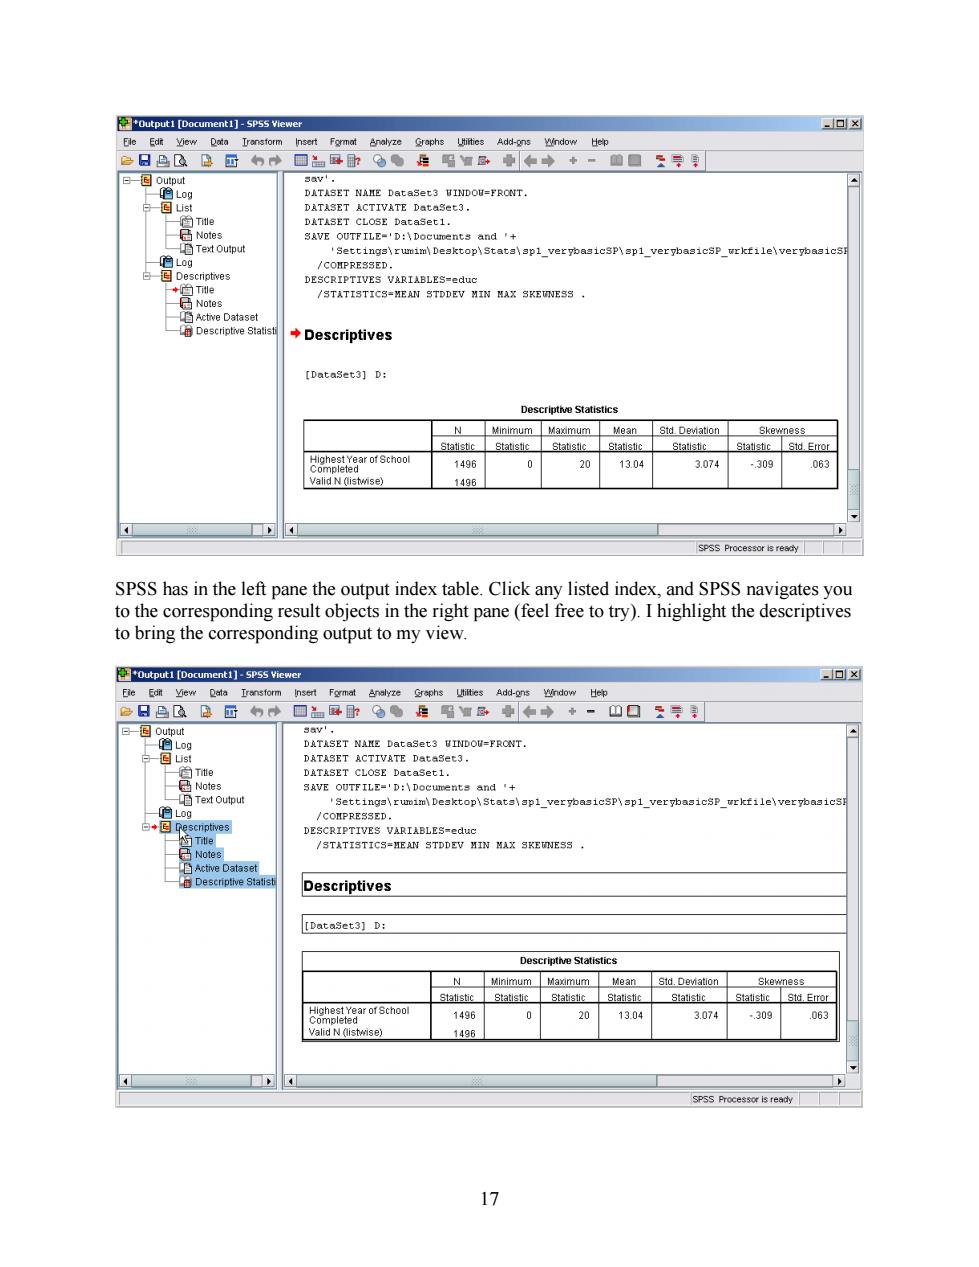
SPSS has in the left pane the output index table. Click any listed index, and SPSS navigates you to the corresponding result objects in the right pane (feel free to try). I highlight the descriptives to bring the corresponding output to my view. 17
You can copy and paste those output items.As an example,try right-clicking on the descriptive table,selecting "Copy,"and then pasting it on your word processor document. The average year of school completed is 13.04 years.Surprisingly,there are people with zero education.There seems to be no real concern about skewness. How different is the mean years of school completed between male and female?Let's compare their mean values. Analyze Compare means Means... This will bring up the"Means"dialogue box.Select the respondent's educ ("Year of school completed")variable under the "Dependent list"heading,and respondent's sex for "Independent list."Click Options...and add median and skewness to your statistics,and then click Continue. Then click Paste.Highlight and run the command. 图Means:0 ptions Statistics: Cell Statistics: Grouped Median Mean Std.Error of Mean Number of Cases Standard Deviation Medan Maximum Skewness Range First Means Last Dependent List Options... Kurtosis RS Highest Degree【… Highest Year of School C. Std.Error of Kurtosis Father's Highest Deg. Std.Error of Skewness Mother's Highest Deg Layer 1 of 1 Harmonic Mean Racew of Responde. Geometric Mean Total Family Income [i.. 幽t Percent of Totol Sum Respondert's incom. Region ot Interview [ Independent List Statistics for First Layer Expanded N.OR.C.S. Respondent's Sex [sex] ☐nove table and eta Size of Place in 1000 ☐Test for linearity OK Reset Cancel Hep ContinuR Cancel Help Comparing years of education by sex. MEANS TABLES=educ BY sex /CELLS MEAN COUNT STDDEV MEDIAN SKEW. You should be seeing the result that on average highest year of education completed is 13.19 for male respondents and 12.92 for female respondents.The median value seems close to the mean value for males,so we would expect the variable is mostly normally distributed.Let's visualize it. Graphs Legacy Dialogues Histogram.… 18
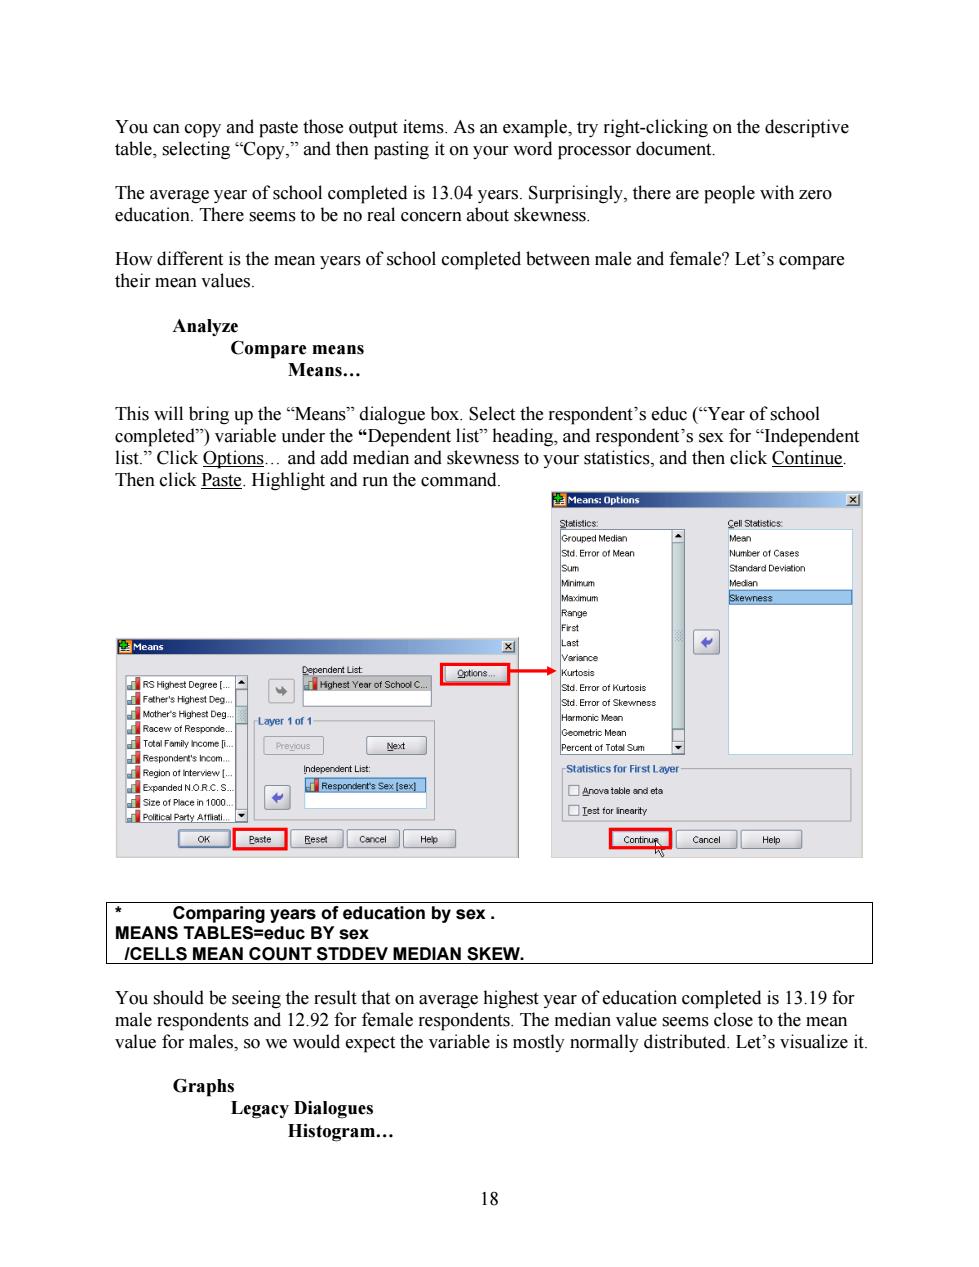
You can copy and paste those output items. As an example, try right-clicking on the descriptive table, selecting “Copy,” and then pasting it on your word processor document. The average year of school completed is 13.04 years. Surprisingly, there are people with zero education. There seems to be no real concern about skewness. How different is the mean years of school completed between male and female? Let’s compare their mean values. Analyze Compare means Means… This will bring up the “Means” dialogue box. Select the respondent’s educ (“Year of school completed”) variable under the “Dependent list” heading, and respondent’s sex for “Independent list.” Click Options… and add median and skewness to your statistics, and then click Continue. Then click Paste. Highlight and run the command. * Comparing years of education by sex . MEANS TABLES=educ BY sex /CELLS MEAN COUNT STDDEV MEDIAN SKEW. You should be seeing the result that on average highest year of education completed is 13.19 for male respondents and 12.92 for female respondents. The median value seems close to the mean value for males, so we would expect the variable is mostly normally distributed. Let’s visualize it. Graphs Legacy Dialogues Histogram… 18
The "Histogram"box pops up.Select the education variable for the "Variable",check the "display normal curve"box and choose"Respondent's Sex"to panel our histogram by column. Histogram x Variable Itles... Respondert ID Numb. Highest Year of School Complet.. Labor Force Stetus [ ☑D3 eplay omal curve Age When First Marri. -Panel by Mu的er of Brothers. Month in Which R Wa. RS Highest Degree【 Father's Highest Deg. Coumns: Mother's Highest Deg. Respondent's Sex [sex] Racew of Responde Respondent's Incom.. Nest variables(no empty columns) Template- Lise chart specificetions from OK Paste Reset Cancel Help Paste the syntax,highlight it,and run. Histogram of years of education by sex. GRAPH /HISTOGRAM(NORMAL)=educ /PANEL COLVAR=sex COLOP=CROSS. And you get your histogram like below. Respondent's Sex Male Female 300 200 100 10 15 202550 10 15 20 25 Highest Year of School Completed 19
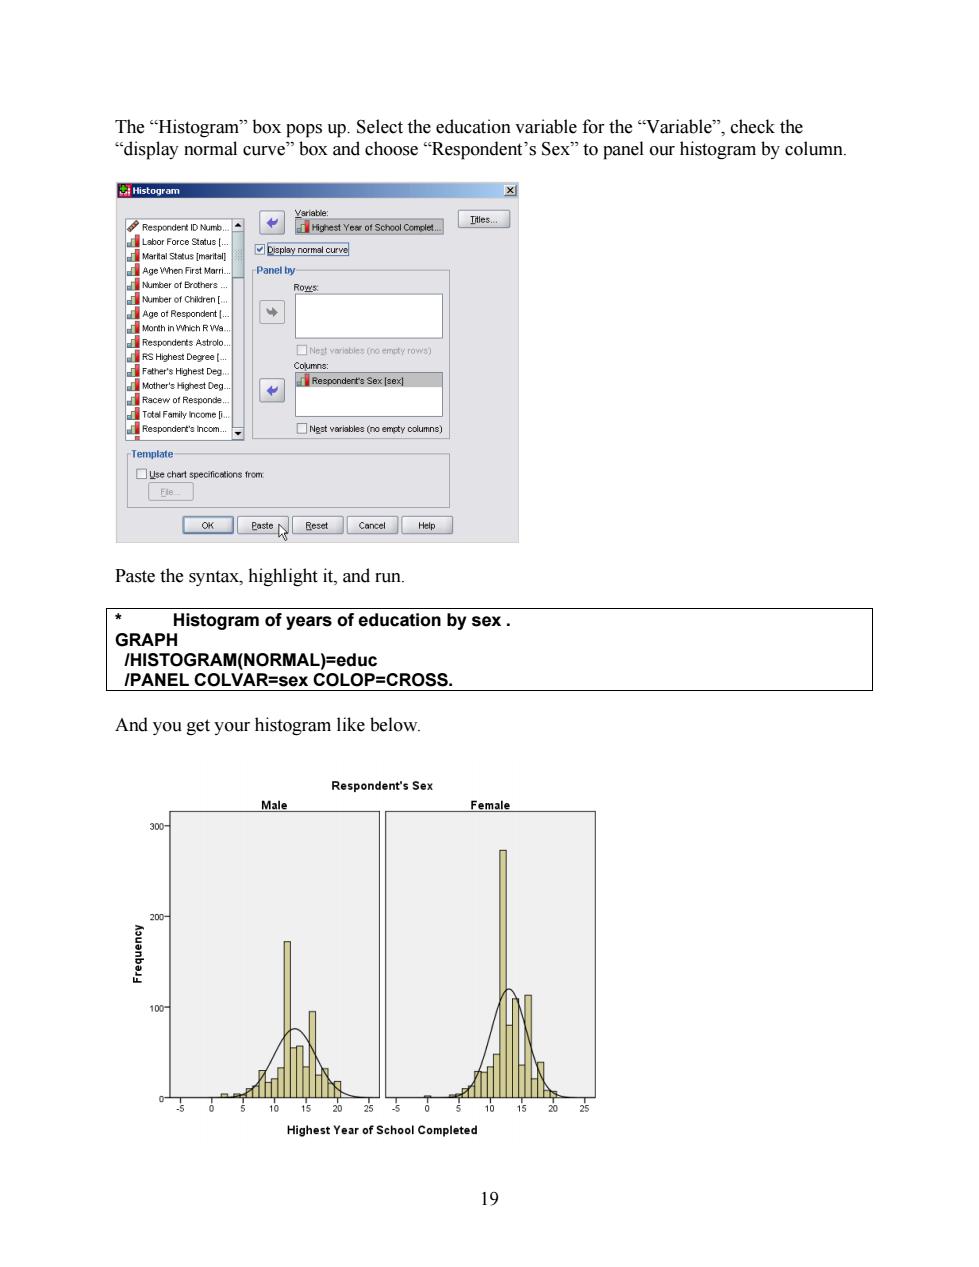
The “Histogram” box pops up. Select the education variable for the “Variable”, check the “display normal curve” box and choose “Respondent’s Sex” to panel our histogram by column. Paste the syntax, highlight it, and run. * Histogram of years of education by sex . GRAPH /HISTOGRAM(NORMAL)=educ /PANEL COLVAR=sex COLOP=CROSS. And you get your histogram like below. 19
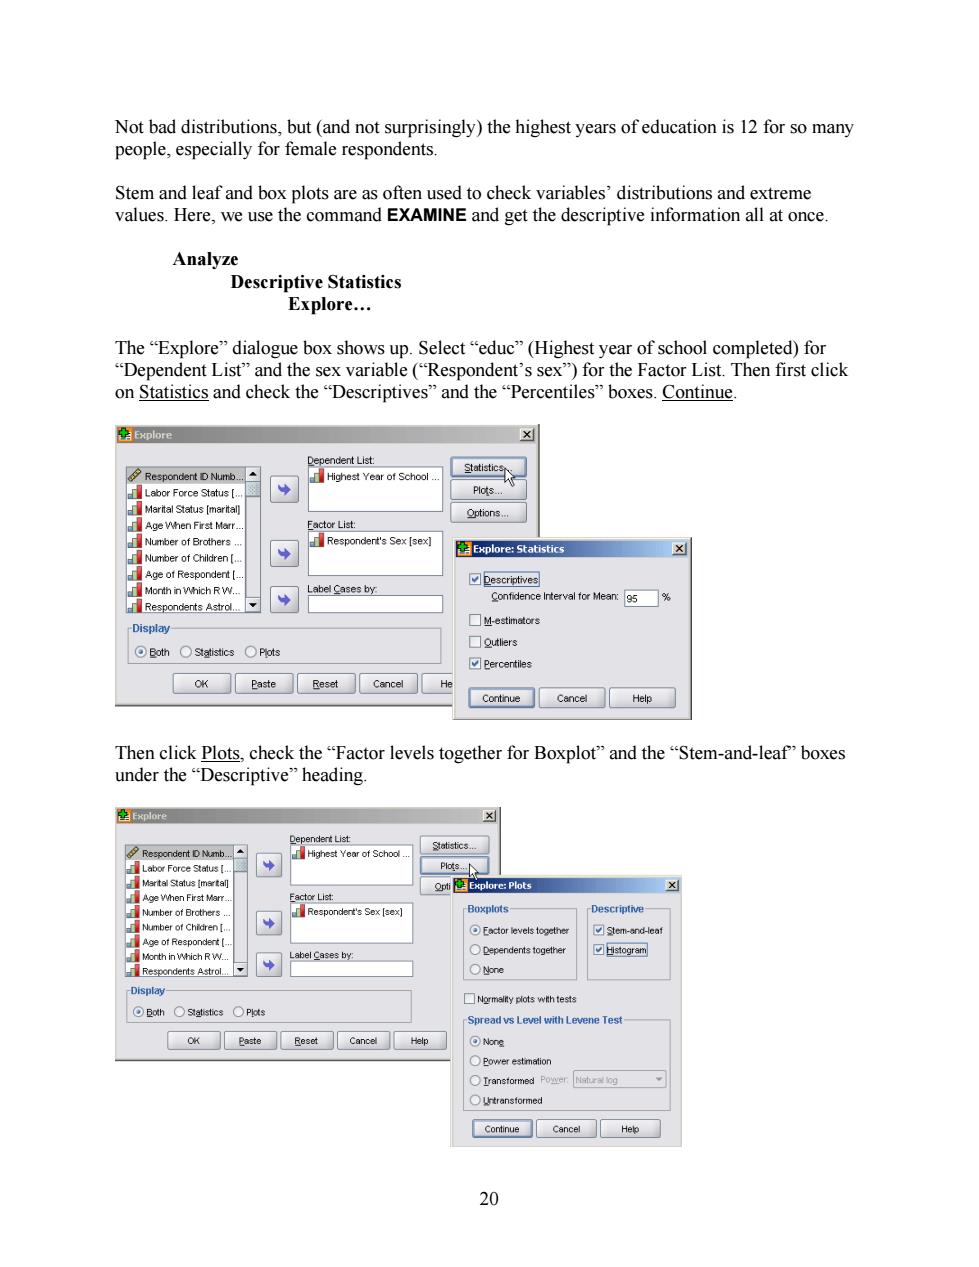
Not bad distributions,but(and not surprisingly)the highest years of education is 12 for so many people,especially for female respondents. Stem and leaf and box plots are as often used to check variables'distributions and extreme values.Here,we use the command EXAMINE and get the descriptive information all at once. Analyze Descriptive Statistics Explore... The"Explore"dialogue box shows up.Select"educ"(Highest year of school completed)for "Dependent List"and the sex variable("Respondent's sex")for the Factor List.Then first click on Statistics and check the "Descriptives"and the "Percentiles"boxes.Continue aExplore Dependent List: Respondent D Numb. Highest Year of School . Labor Force Status [. Plots... Marital Status [marital] Options.. Age When First Marr Factor List: Number of Brothers Respondent's Sex [sex] Number of Children【. 图Explore:Statistics Age of Respondent [ ☑Descriptives Month in Which R W.. abel Cases by Respondents Astrol.. Confidence Interval for Mean:95% ☐M-estimators -Display ☐Qutliers ☑Percentiles OK easte Reset Cancel He Continue Cancel Help Then click Plots,check the "Factor levels together for Boxplot"and the"Stem-and-leaf'boxes under the“Descriptive'”heading. plore Dependent List Statistics.. Respondent D Numb. Highest Year of School Labor Force Status [ Pas.人 Martal Status [mertal] Qpt图Explore:Plots x Ace vhen First Mat Factor List: Number of Brothers Respondent's Sex [sex] Boxplots Descriptive- Number of Chidren [ Eactor levels together ☑tem-and-leat Month in Which R W.. Label Cases by: ○Dependents together ☑出istogram Respondents Astrol三 Display- ☐Normallty plots with tests Both Statistics○Pts -Spread vs Level with Levene Test OK Paste Reset Cancel Help Nong ○Power estimation ○transformed Continue Cancel Help 20
Not bad distributions, but (and not surprisingly) the highest years of education is 12 for so many people, especially for female respondents. Stem and leaf and box plots are as often used to check variables’ distributions and extreme values. Here, we use the command EXAMINE and get the descriptive information all at once. Analyze Descriptive Statistics Explore… The “Explore” dialogue box shows up. Select “educ” (Highest year of school completed) for “Dependent List” and the sex variable (“Respondent’s sex”) for the Factor List. Then first click on Statistics and check the “Descriptives” and the “Percentiles” boxes. Continue. Then click Plots, check the “Factor levels together for Boxplot” and the “Stem-and-leaf” boxes under the “Descriptive” heading. 20