childs f1.0 age f2.0. execute. The command GET DATA is to read external files into SPSS For further syntax help,you always can go from the menu bar at the top, Help Command Syntax Reference We will learn some additional basics of command writing throughout this workshop. We can also directly input the data from the Syntax Editor.Type the following lines. Read dataline from syntax file. data list id 1-3 sex 5(A)age 7-8 treat 10. begin data 001f430 002f251 003m360 end data. We use two commands.One is DATA LIST (we already learned it),and the other is a pair of BEGIN DATA and END DATA.Again notice each command is finalized by a period at the end BEGIN DATA and END DATA are used when data are entered within the command sequence, and data records are placed in between. One important thing you need to remember from this example is this part: sex 5(A) By default,SPSS treats variables as numeric.The variable sex here is a character variable(f/m). By putting (A)after the variable name and the column number,you tell SPSS that this is a character variable. Open SPSS files Now,let's open an SPSS system file "GSS93 subset.sav."This is actually the easiest part.From the menu bar of the SPSS Data Editor window at the top,go: File Open Data.… 11
childs f1.0 age f2.0. execute. The command GET DATA is to read external files into SPSS. For further syntax help, you always can go from the menu bar at the top, Help Command Syntax Reference We will learn some additional basics of command writing throughout this workshop. We can also directly input the data from the Syntax Editor. Type the following lines. * Read dataline from syntax file . data list / id 1-3 sex 5 (A) age 7-8 treat 10. begin data 001 f 43 0 002 f 25 1 003 m 36 0 end data. We use two commands. One is DATA LIST (we already learned it), and the other is a pair of BEGIN DATA and END DATA. Again notice each command is finalized by a period at the end. BEGIN DATA and END DATA are used when data are entered within the command sequence, and data records are placed in between. One important thing you need to remember from this example is this part: sex 5 (A) By default, SPSS treats variables as numeric. The variable sex here is a character variable (f/m). By putting (A) after the variable name and the column number, you tell SPSS that this is a character variable. Open SPSS files Now, let’s open an SPSS system file “GSS93 subset.sav.” This is actually the easiest part. From the menu bar of the SPSS Data Editor window at the top, go: File Open Data… 11
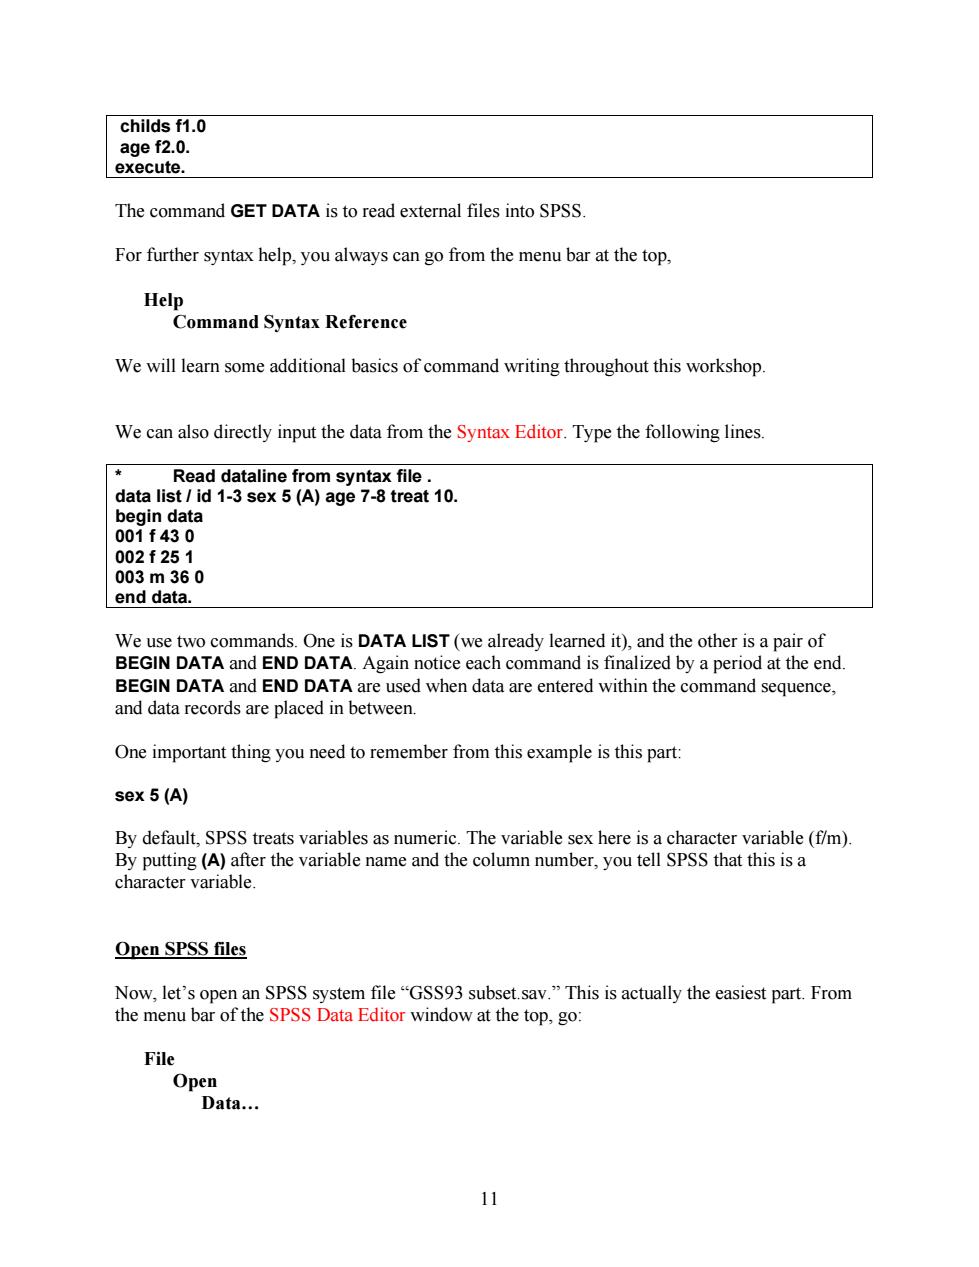
Find and open"GSS93 subset.sav"by double-clicking on it or choosing it and hitting OK 图pen Data Look in: verybasicSP 可aw88 G 国GSs93tks.saY 国×s_93s93.3ay Recent © Desktop 9 My Documents 即 My Computer File pame Qpen Files of type: SPSS (sav) Paste My Network Minimize string wicths based on observed values Cancel There you go.Let's click on the tab of the"Variable View"sheet and see what you have there. G5593 subset.sav [DataSet3]-5PS5 Data Editor 一回× Ele Edt yiew Date Iransform Analyze Graphs iities Add-ons Wndow Help 公口凸匠的◆品卧卧:麟相由哥办铝g 1:d Visible:67 of 67 Variables id wrkstat marital agewed sibs childs age birthmo 1 1 3 20 3 1 43 5 3 5 0 0 44 3 3 25 2 0 43 4 4 2 5 0 4 0 45 99 S 5 5 0 1 0 78 6 6 25 2 2 83 7 7 1 22 2 2 55 10 ⊙ 8 24 2 5 9 9 22 2 31 10 10 2 0 1 0 54 3 11 11 1 5 0 0 29 Data View Varisble View SPSS Processor is ready Here's what you should be seeing now. 12
Find and open “GSS93 subset.sav” by double-clicking on it or choosing it and hitting OK. There you go. Let’s click on the tab of the “Variable View” sheet and see what you have there. Here’s what you should be seeing now. 12
GS593 subset.sav [DataSet3]-SPSS Data Editor Can also get each variable's information here. ▣x File Edit View 卫ate Iransform Analyze Graphs zcow Help 色日马匠 国围纳 帽南昌韭雪 b● Name Type Width Decimals Label Values Missing Columns Numeric 4 0 Respondent ID...None None wrkstat Numeric 0 Labor Force St...(O.NAP). 0.9 8 3 marital Numeric 0 Marital Status (1.married)...9 8 4 agewed Numeric 2 0 Age When First...(0,nap... 0,98,99 8 5 sibs Numeric 2 0 Number of Brot...(98,dk)... 98,99 8 6 childs Numeric 0 Number of Chil...(8,Eight or...9 8 个 age Numeric 2 0 Age of Respon... 98,DK. 0.98,99 8 birthmo Numeric 0 Month in Which...(0.NAP).. 0,98,99 8 9 zodiac Numeric 2 0 Respondents A..(0.NAP)... 0,98,99 8 10 educ Numeric 0 Highest Year of...(97,NAP).97,98,99 8 11 degree Numeric 1 0 RS Highest De...{0,Less tha..:7,8.9 8 12 padeg Numeric 1 0 Father's Highes...(O,LT High...7.8.9 8 13 madeg Numeric 1 0 Mother's Highe...(LT High... 7,8.9 8 Data View Variable View SPSS Processor is ready The Data View sheet and the Variable View sheet look very similar,but the latter has information about the variables in the data set shown in the Data View sheet,including variable names,data type (Numeric or string,etc),variable and value labels,how the missing values are coded,etc. Most of those information cells have hidden dialogue boxes or pull-down menus which you can call up by selecting the cell and then clicking on the gray button that comes up on the right side of the cell.For example,let's try activating the dialogue box for the values of the variable c“marital.” GS593 subset.sav [DataSet3]-SPS5 Data Editor -▣x Eile Edit Yiew Data Iransform Analyze Graphs Utilities Add-ons Window Help 它日色 四 中之辱:韩帽血 昌止雷 多% Name Type Width Decimals Label Values Missing 1 id Numeric 4 0 Respondent ID...None (1)Click on this 2 wrkstat Numeric 0 Labor Force St... NAP) button 3 marital Numeric 1 0 Marital Status Tiarried)... 4 agewed Numeric 2 0 Age When First...(Cl,nap) R0.98.99 Data View Variable view SPSS Processor is ready 13
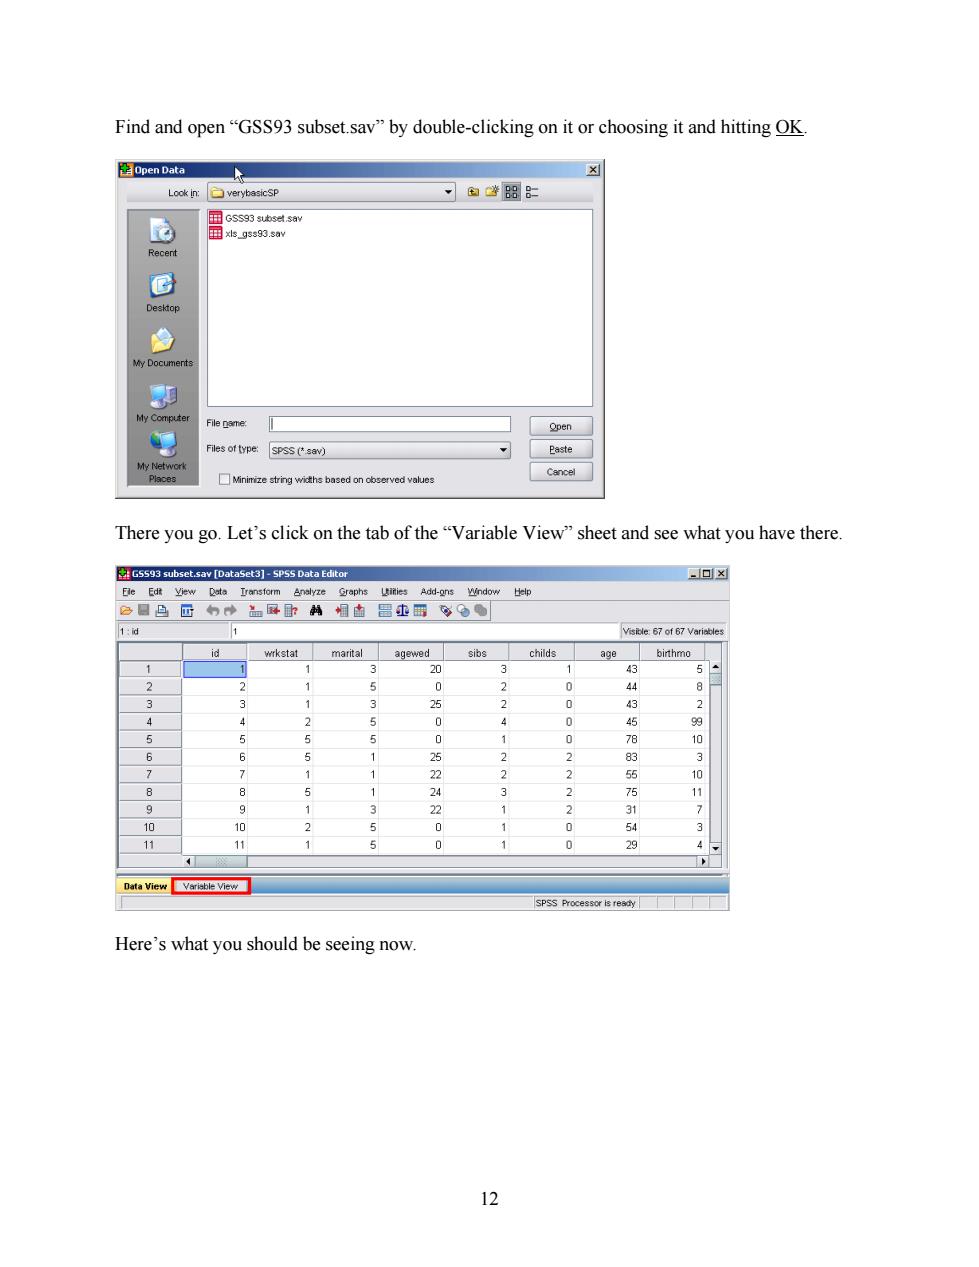
The Data View sheet and the Variable View sheet look very similar, but the latter has information about the variables in the data set shown in the Data View sheet, including variable names, data type (Numeric or string, etc), variable and value labels, how the missing values are coded, etc. Most of those information cells have hidden dialogue boxes or pull-down menus which you can call up by selecting the cell and then clicking on the gray button that comes up on the right side of the cell. For example, let’s try activating the dialogue box for the values of the variable “marital.” Can also get each variable’s information here. (1) Click on this button 13
图Value Labels Value Labels Value: Spelling.. Label: Add 1="married" (2)Then value labels dialogue box for the 2■"widowed" Change variable“narital" 3="divorced" shows up. 4 ="separated" 5="never married" 9=NA" OK Cancel Help Now,technically this box allows you to define/modify values of the variable.However,I just brought this up to warn you in case you happen to find it and want to use it.DON'T USE THIS BOX for the data management purposes.Although it looks easy,to use this dialogue box is dangerous.It makes it extremely difficult to keep track of changes you made to the data,because it does not leave any record of your action.You should use the Syntax Editor instead.Let's just click Cancel to close the "Value Labels"dialogue box. Let's close all the data sources other than the one we just read in,"GSS93 subset.sav." 2.How to Get Descriptive Statistics and Graphs In this section,we will learn how to explore our data by running simple descriptive statistics and drawing graphs.We do both the point-and-click approach and the syntax approach Let's get started.We still have the"GSS93 subset.sav"data in SPSS(if not,open it).We first want to have descriptive information of the variable"educ."From the menu bar at the top,go: Analyze Descriptive Statistics... Descriptives This brings you a dialogue box named "Descriptives.You have a list of the variables in the left pane.Let's select the variable educ ("Highest Year of School Completed")by double-clicking on them,OR by highlighting the variable(you can select multiple variables by clicking on them while pressing and holding the Ctrl key)and then hitting the arrow button between the two panes. Then let's click the Options...button and you have the "Descriptives:Options"dialogue box. We can check boxes of statistics we want to see.So suppose we want to check mean,standard deviation,minimum,maximum,and skewness values of these two variables.Click Continue. You are back to the "Descriptives"box. 14
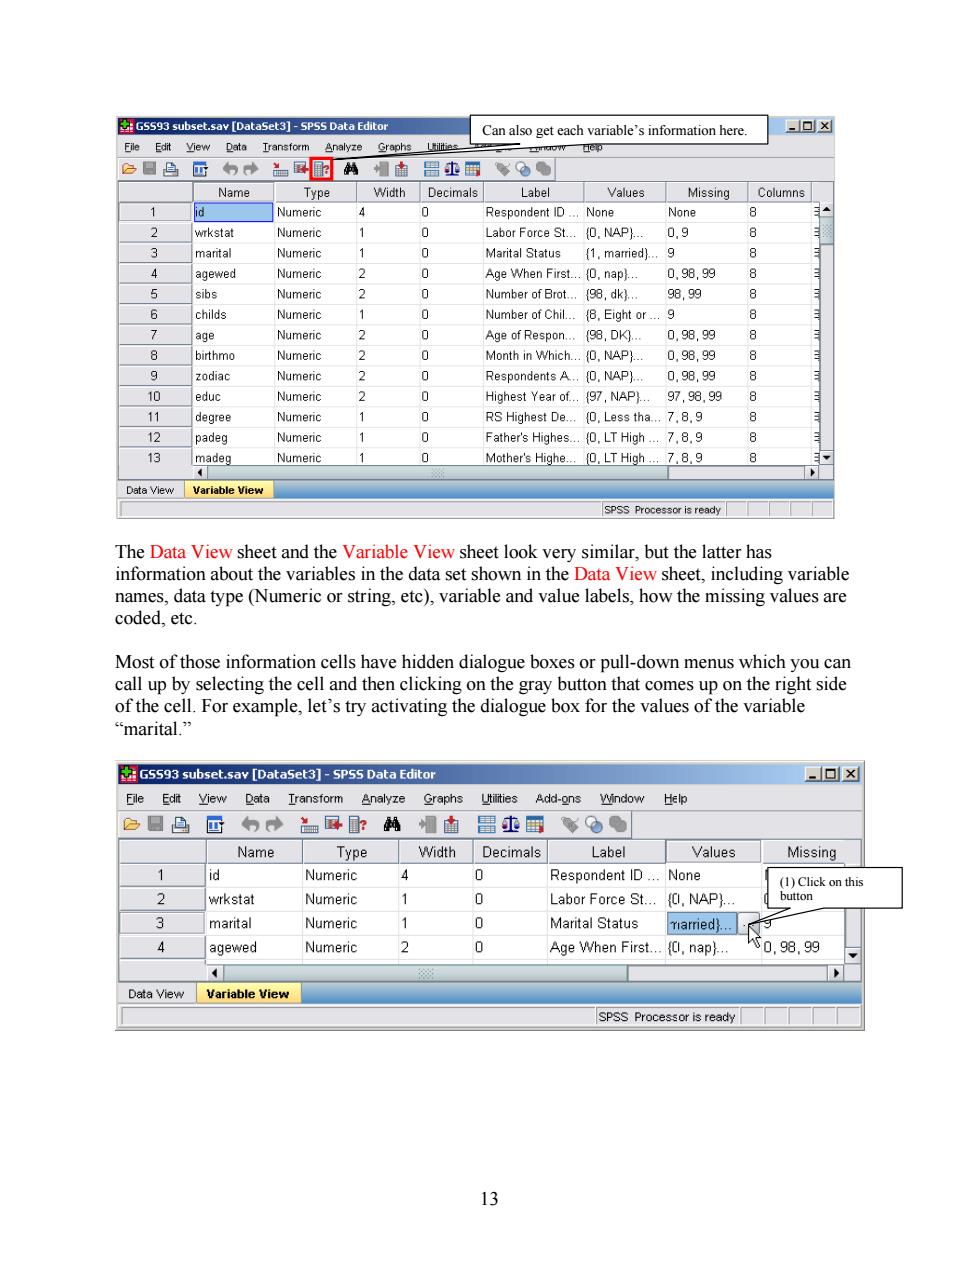
(2) Then value labels dialogue box for the variable “marital” shows up. Now, technically this box allows you to define/modify values of the variable. However, I just brought this up to warn you in case you happen to find it and want to use it. DON’T USE THIS BOX for the data management purposes. Although it looks easy, to use this dialogue box is dangerous. It makes it extremely difficult to keep track of changes you made to the data, because it does not leave any record of your action. You should use the Syntax Editor instead. Let’s just click Cancel to close the “Value Labels” dialogue box. Let’s close all the data sources other than the one we just read in, “GSS93 subset.sav.” 2. How to Get Descriptive Statistics and Graphs In this section, we will learn how to explore our data by running simple descriptive statistics and drawing graphs. We do both the point-and-click approach and the syntax approach. Let’s get started. We still have the “GSS93 subset.sav” data in SPSS (if not, open it). We first want to have descriptive information of the variable “educ.” From the menu bar at the top, go: Analyze Descriptive Statistics… Descriptives This brings you a dialogue box named “Descriptives.” You have a list of the variables in the left pane. Let’s select the variable educ (“Highest Year of School Completed”) by double-clicking on them, OR by highlighting the variable (you can select multiple variables by clicking on them while pressing and holding the Ctrl key) and then hitting the arrow button between the two panes. Then let’s click the Options… button and you have the “Descriptives: Options” dialogue box. We can check boxes of statistics we want to see. So suppose we want to check mean, standard deviation, minimum, maximum, and skewness values of these two variables. Click Continue. You are back to the “Descriptives” box. 14
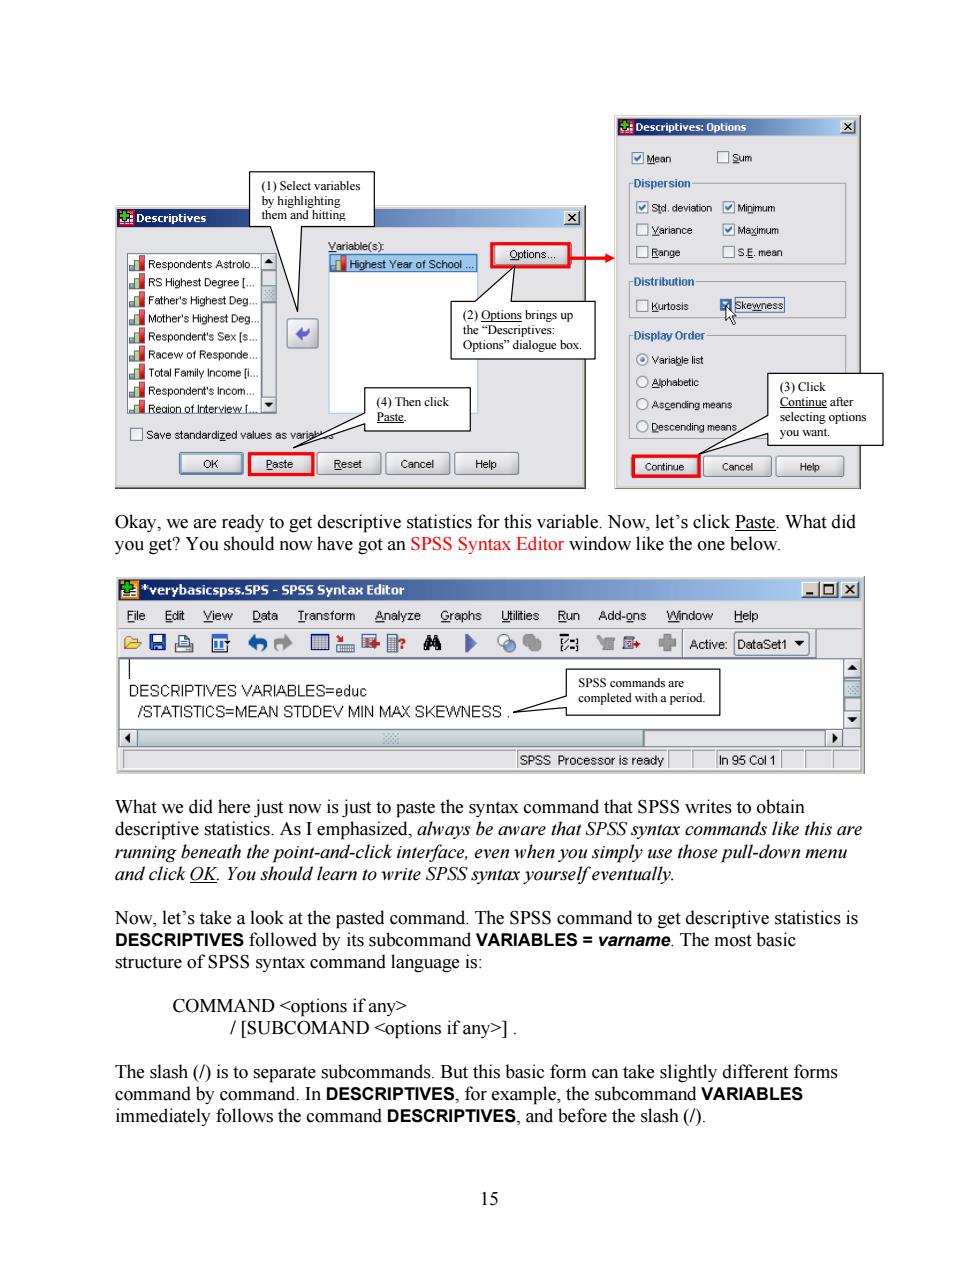
Descriptives:Options X ☑Mean ☐3um (1)Select variables Dispersion- by highlighting Descriptives them and hitting ☑std,deviation☑Mipimum ☐Variance ☑Ma送imum Variable(s) Respondents Astrolo. Highest Year of School.. Options... ☐Range ☐sE,mean RS Highest Degree [. Distribution Father's Highest Deg. ■urtosis Skewness Mother's Highest Deg. (2)Options brings up Respondent's Sex [s.. the“Descriptives:: Display Order Options"dialogue box. Racew of Responde. Variable list Total Family Income [i.. Alphabetic Respondent's Incom.. (3)Click (4)Then click ○Ascending means Continue after Paste. selecting options ○Descending means. Save standardized values as you want. OK Paste Reset Cancel Help Continue Cancel Help Okay,we are ready to get descriptive statistics for this variable.Now,let's click Paste.What did you get?You should now have got an SPSS Syntax Editor window like the one below. verybasicspss.SPS-SPSS Syntax Editor ▣x File Edit View Data Iransform Analyze Graphs Utilities Run Add-ons Window Help 色日凸回的→■量:的● 色 %■园+ Active:DataSet1 DESCRIPTIVES VARIABLES=educ SPSS commands are completed with a period. /STATISTICS=MEAN STDDEV MIN MAX SKEWNESS SPSS Processor is ready In 95 Col 1 What we did here just now is just to paste the syntax command that SPSS writes to obtain descriptive statistics.As I emphasized,always be aware that SPSS syntax commands like this are running beneath the point-and-click interface,even when you simply use those pull-down menu and click OK.You should learn to write SPSS syntax yourselfeventually Now,let's take a look at the pasted command.The SPSS command to get descriptive statistics is DESCRIPTIVES followed by its subcommand VARIABLES varname.The most basic structure of SPSS syntax command language is: COMMAND <options if any> [SUBCOMAND <options if any>]. The slash (/is to separate subcommands.But this basic form can take slightly different forms command by command.In DESCRIPTIVES,for example,the subcommand VARIABLES immediately follows the command DESCRIPTIVES,and before the slash(/). 15
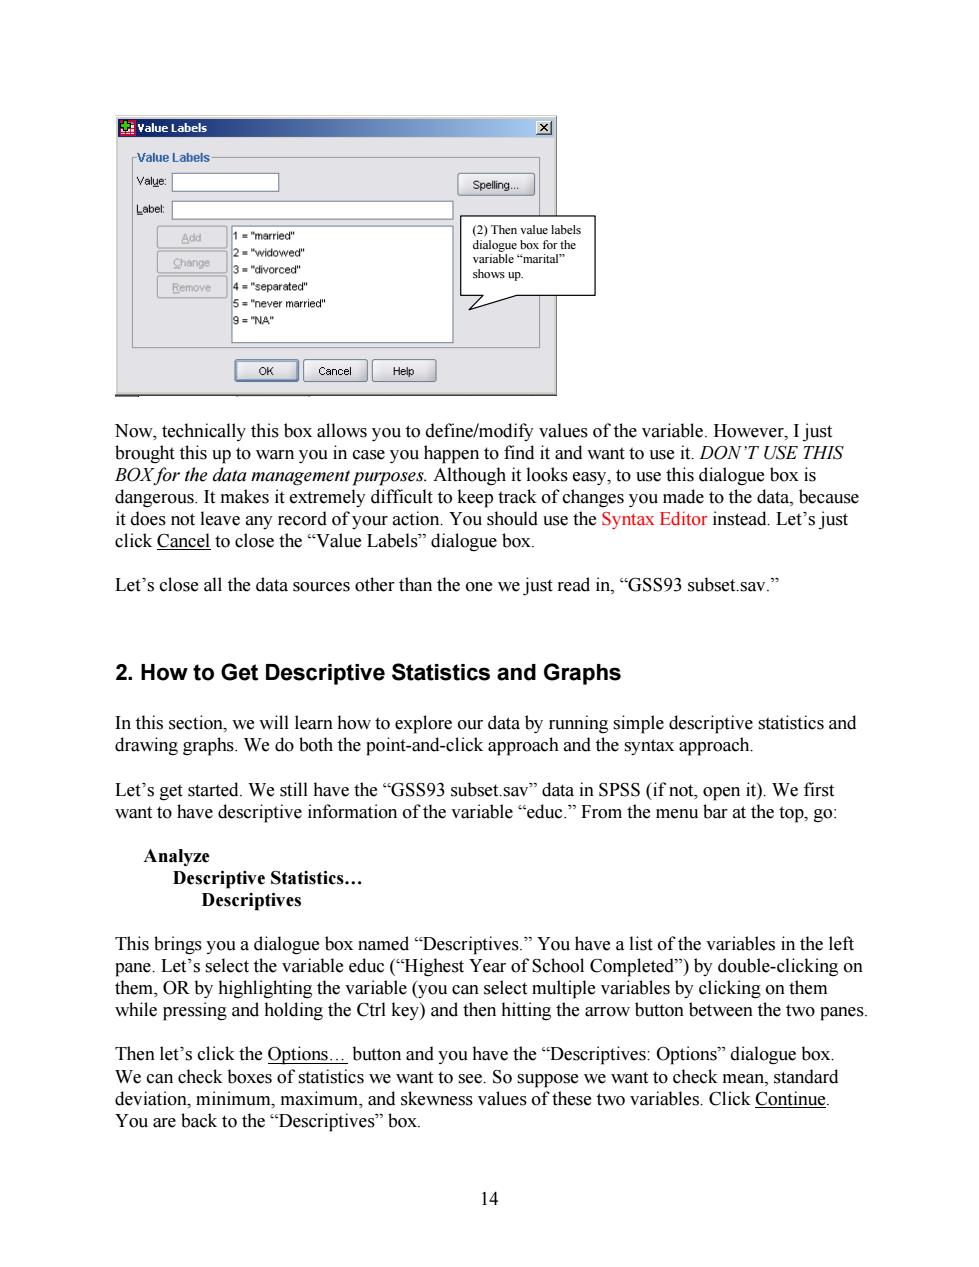
(4) Then click Paste. (3) Click Continue after selecting options you want. (2) Options brings up the “Descriptives: Options” dialogue box. (1) Select variables by highlighting them and hitting Okay, we are ready to get descriptive statistics for this variable. Now, let’s click Paste. What did you get? You should now have got an SPSS Syntax Editor window like the one below. SPSS commands are completed with a period. What we did here just now is just to paste the syntax command that SPSS writes to obtain descriptive statistics. As I emphasized, always be aware that SPSS syntax commands like this are running beneath the point-and-click interface, even when you simply use those pull-down menu and click OK. You should learn to write SPSS syntax yourself eventually. Now, let’s take a look at the pasted command. The SPSS command to get descriptive statistics is DESCRIPTIVES followed by its subcommand VARIABLES = varname. The most basic structure of SPSS syntax command language is: COMMAND <options if any> / [SUBCOMAND <options if any>] . The slash (/) is to separate subcommands. But this basic form can take slightly different forms command by command. In DESCRIPTIVES, for example, the subcommand VARIABLES immediately follows the command DESCRIPTIVES, and before the slash (/). 15