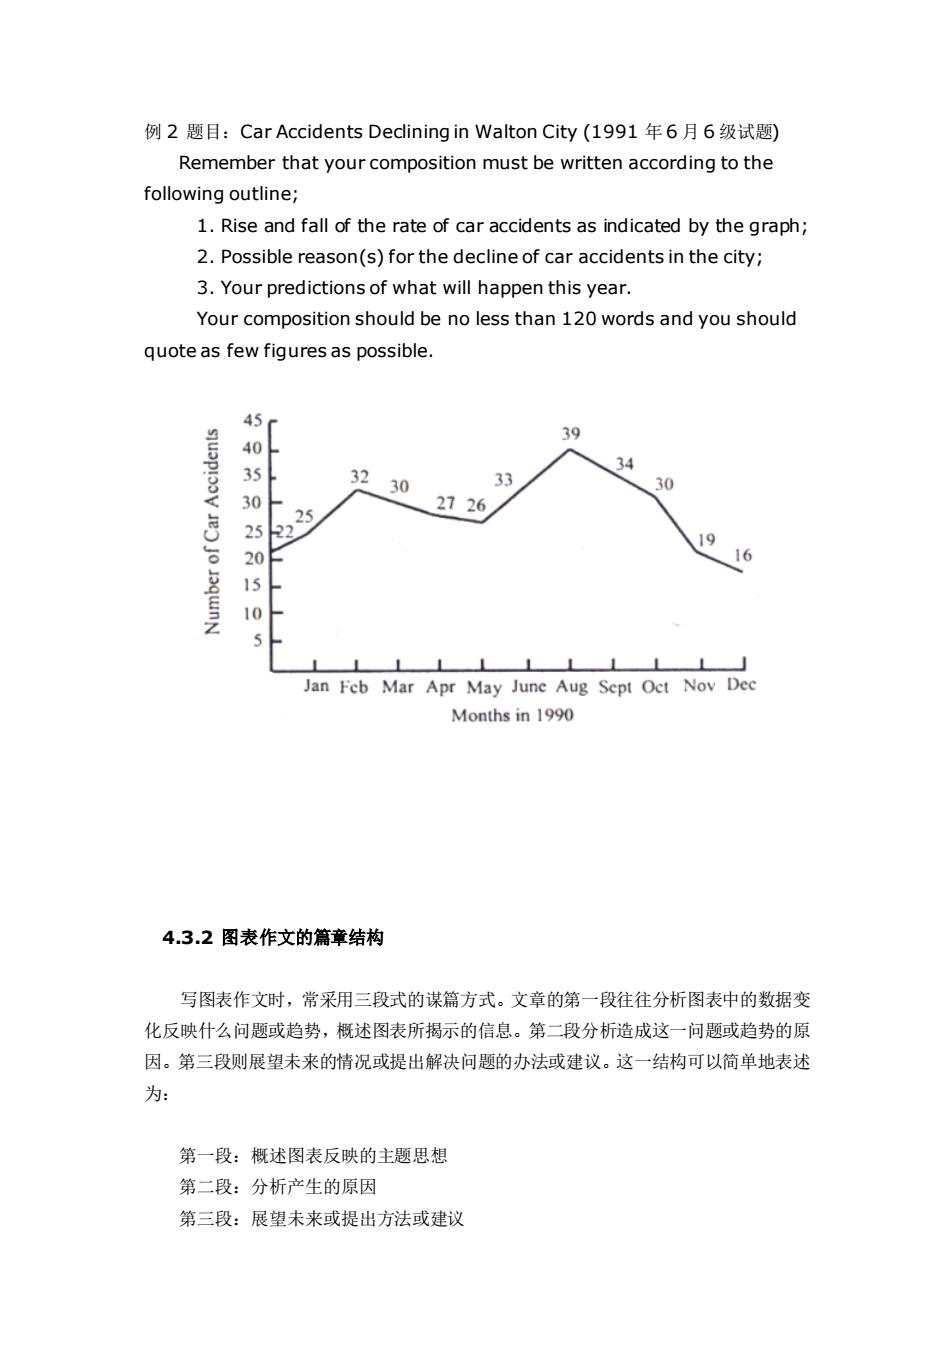
例2题目:CarAccidentsDeclininginWaltonCity(1991年6月6级试题)Rememberthatyourcompositionmustbewrittenaccordingtothefollowingoutline;1. Rise and fall of the rate of car accidents as indicated by the graph;2.Possiblereason(s)forthedeclineof caraccidentsinthecity;3.Yourpredictionsofwhatwillhappenthisyear.Yourcompositionshouldbenolessthan12owordsandyoushouldquoteas few figuresas possible.4539403435323330300272651192161510.JanFebMarAprMayJuneAugSeptOctNovDecMonthsin19904.3.2图表作文的篇章结构写图表作文时,常采用三段式的谋篇方式。文章的第一段往往分析图表中的数据变化反映什么问题或趋势,概述图表所揭示的信息。第二段分析造成这一问题或趋势的原因。第三段则展望未来的情况或提出解决问题的办法或建议。这一结构可以简单地表述为:第一段:概述图表反映的主题思想第二段:分析产生的原因第三段:展望未来或提出方法或建议
例 2 题目:Car Accidents Declining in Walton City (1991 年 6 月 6 级试题) Remember that your composition must be written according to the following outline; 1. Rise and fall of the rate of car accidents as indicated by the graph; 2. Possible reason(s) for the decline of car accidents in the city; 3. Your predictions of what will happen this year. Your composition should be no less than 120 words and you should quote as few figures as possible. 4.3.2 图表作文的篇章结构 写图表作文时,常采用三段式的谋篇方式。文章的第一段往往分析图表中的数据变 化反映什么问题或趋势,概述图表所揭示的信息。第二段分析造成这一问题或趋势的原 因。第三段则展望未来的情况或提出解决问题的办法或建议。这一结构可以简单地表述 为: 第一段:概述图表反映的主题思想 第二段:分析产生的原因 第三段:展望未来或提出方法或建议
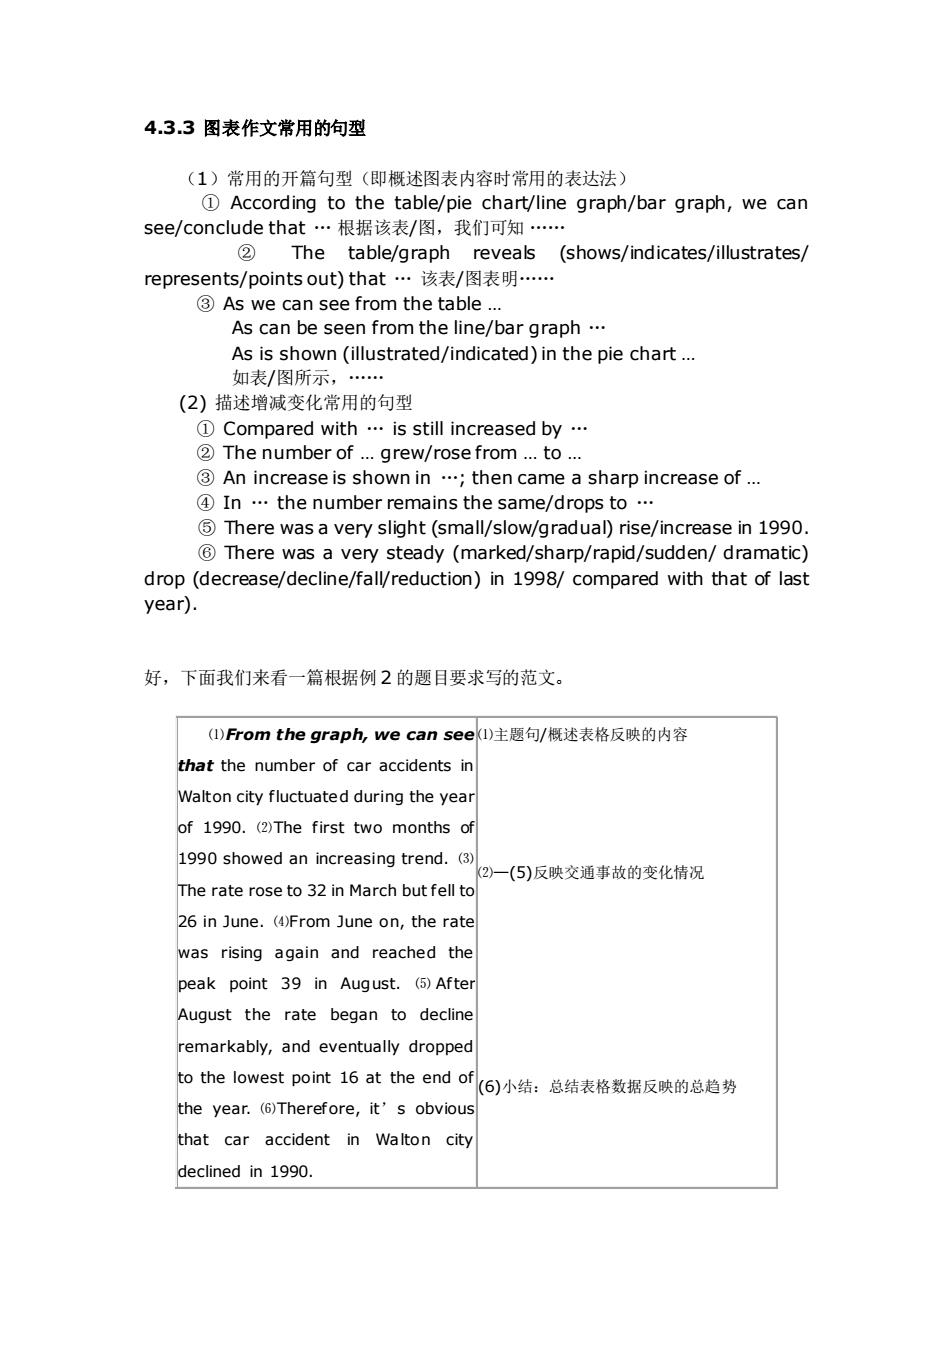
4.3.3图表作文常用的句型(1)常用的开篇句型(即概述图表内容时常用的表达法)① According to the table/pie chart/line graph/bargraph, we cansee/concludethat根据该表/图,我们可知.②Thetable/graphreveals(shows/indicates/illustrates/represents/pointsout)that.该表/图表明....Aswecanseefromthetable..As can beseenfrom the line/bargraph .As is shown (illustrated/indicated) in the pie chart ...如表/图所示,(2)描述增减变化常用的句型@Comparedwith..isstill increasedby...②The number of...grew/rosefrom ... to...③Anincreaseisshownin...;thencameasharpincreaseof...@In...thenumberremainsthesame/dropstoTherewasaveryslight (small/slow/gradual)rise/increase in1990?Therewasaverysteady(marked/sharp/rapid/sudden/dramatic)drop (decrease/decline/fall/reduction) in 1998/ compared with that of lastyear).好,下面我们来看一篇根据例2的题目要求写的范文。(1)Fromthegraph,wecansee(1)主题句/概述表格反映的内容that the number of car accidents inWalton cityfluctuated during theyearof 1990.(2)Thefirsttwomonthsof1990 showed an increasing trend. (3)k2)一(5)反映交通事故的变化情况Therateroseto32 inMarchbutfell to26in June.(4)FromJuneon,theratewas rising again and reached thepeak point39 in August.(5)AfterAugust the rate began to declineremarkably,and eventually droppedto the lowest point 16 at the end of(6)小结:总结表格数据反映的总趋势the year. (6)Therefore, it' s obviousthat car accident in Walton citydeclined in1990
4.3.3 图表作文常用的句型 (1)常用的开篇句型(即概述图表内容时常用的表达法) ① According to the table/pie chart/line graph/bar graph, we can see/conclude that . 根据该表/图,我们可知 . ② The table/graph reveals (shows/indicates/illustrates/ represents/points out) that . 该表/图表明. ③ As we can see from the table . As can be seen from the line/bar graph . As is shown (illustrated/indicated) in the pie chart . 如表/图所示,. (2) 描述增减变化常用的句型 ① Compared with . is still increased by . ② The number of . grew/rose from . to . ③ An increase is shown in .; then came a sharp increase of . ④ In . the number remains the same/drops to . ⑤ There was a very slight (small/slow/gradual) rise/increase in 1990. ⑥ There was a very steady (marked/sharp/rapid/sudden/ dramatic) drop (decrease/decline/fall/reduction) in 1998/ compared with that of last year). 好,下面我们来看一篇根据例 2 的题目要求写的范文。 ⑴From the graph, we can see that the number of car accidents in Walton city fluctuated during the year of 1990. ⑵The first two months of 1990 showed an increasing trend. ⑶ The rate rose to 32 in March but fell to 26 in June. ⑷From June on, the rate was rising again and reached the peak point 39 in August. ⑸ Af ter August the rate began to decline remarkably, and eventually dropped to the lowest point 16 at the end of the year. ⑹Therefore, it’s obvious that car accident in Walton city declined in 1990. ⑴主题句/概述表格反映的内容 ⑵—(5)反映交通事故的变化情况 (6)小结:总结表格数据反映的总趋势
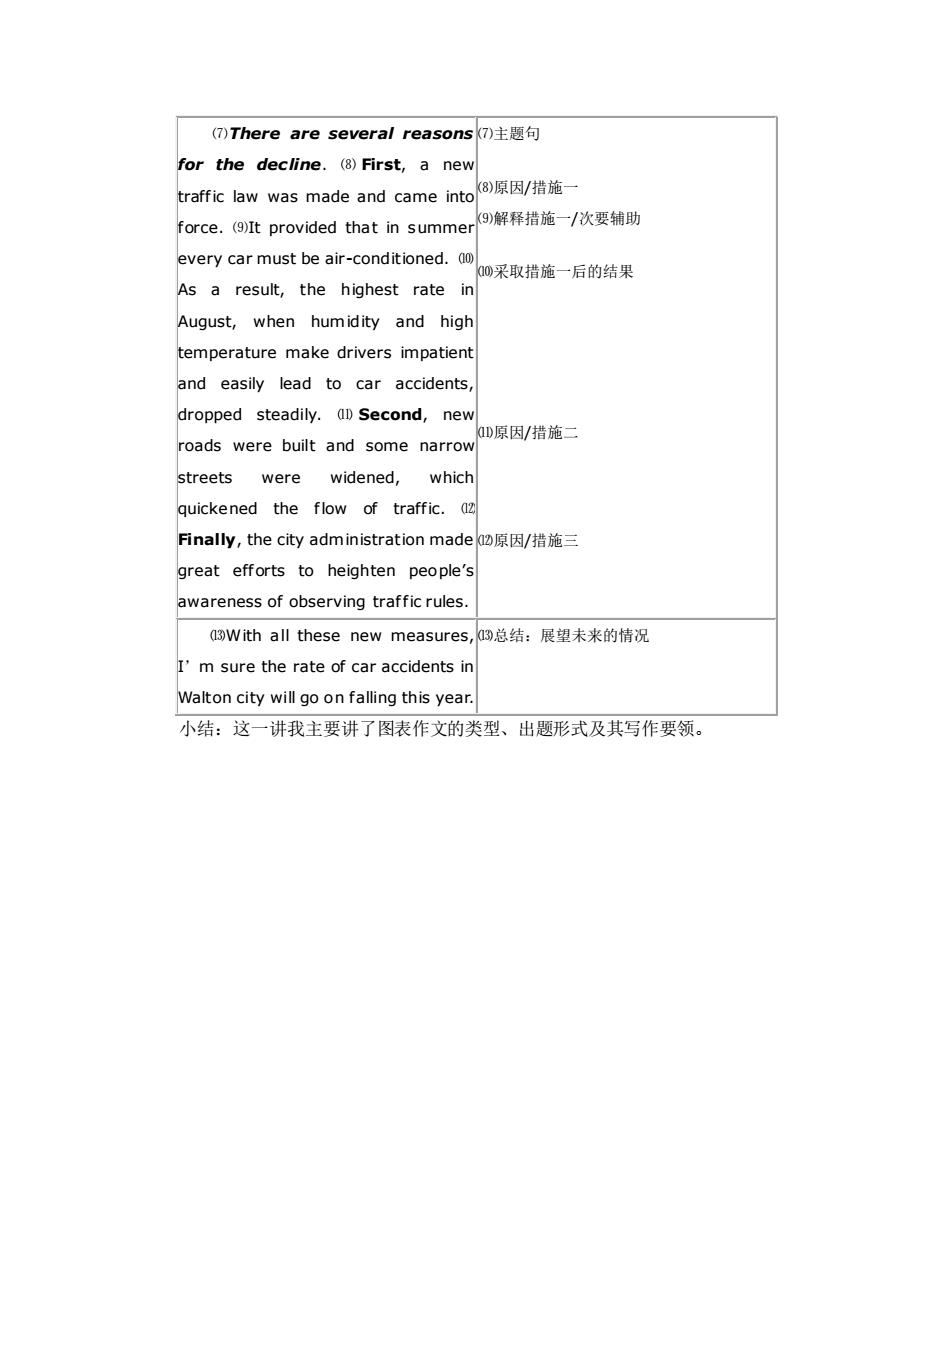
(7)Thereareseveralreasons(7)主题句for the decline.(8)First,a new(8)原因/措施一traffic law was made and came intok9)解释措施一/次要辅助force.(9)It provided that in summerevery carmust be air-conditioned.(0)00)采取措施一后的结果As aresult,the highest rateinAugust, when humidity and hightemperature make drivers impatientand easily lead to car accidents,dropped steadily.(l)Second,new(D)原因/措施二roadswere built and some narrowwhichstreetswidened,werequickened the flow of traffic. azFinally,thecityadministrationmade2)原因/措施三great efforts to heighten people'sawareness of observing traffic rules.(3Withallthesenewmeasures,3)总结:展望未来的情况I'msuretherateof caraccidentsinWalton city will go on falling this year.小结:这一讲我主要讲了图表作文的类型、出题形式及其写作要领
⑺There are several reasons for the dec line. ⑻ First, a new traffic law was made and came into force. ⑼It provided that in summer every car must be air-conditioned. ⑽ As a result, the highest rate in August, when humidity and high temperature make drivers impatient and easily lead to car accidents, dropped steadily. ⑾ Second, new roads were built and some narrow streets were widened, which quickened the flow of traffic. ⑿ Finally, the city administration made great efforts to heighten people’s awareness of observing traf fic rules. ⑺主题句 ⑻原因/措施一 ⑼解释措施一/次要辅助 ⑽采取措施一后的结果 ⑾原因/措施二 ⑿原因/措施三 ⒀With all these new measures, I’m sure the rate of car accidents in Walton city will go on falling this year. ⒀总结:展望未来的情况 小结:这一讲我主要讲了图表作文的类型、出题形式及其写作要领