JIAOTONG UNIVERSITY 1096 Supply Chain Management Lecture 7-1 Demand Forecasting with Excel Instructor(s) Prof.Jianjun Gao Department of Automation School of Electronic Information and Electrical Engineering SEIEE AU406
Supply Chain Management Instructor(s) SEIEE AU406 + - Demand Forecasting with Excel Prof. Jianjun Gao Department of Automation School of Electronic Information and Electrical Engineering Lecture 7-1
Outline This lecture note is a complementary of the lecture 2. Review of forecasting method (Lecture 2) ■Static method Implementation in Excel SEIEE AU406 6-2
+ - SEIEE AU406 Outline Review of forecasting method (Lecture 2) Static method Implementation in Excel 6-2 This lecture note is a complementary of the lecture 2

Characteristics of Forecasts Forecasts are always wrong.Should include expected value and measure of error. Long-term forecasts are less accurate than short-term forecasts (forecast horizon is important) Aggregate forecasts are more accurate than disaggregate forecasts SEIEE AU406 7-3
+ - SEIEE AU406 7-3 Characteristics of Forecasts Forecasts are always wrong. Should include expected value and measure of error. Long-term forecasts are less accurate than short-term forecasts (forecast horizon is important) Aggregate forecasts are more accurate than disaggregate forecasts
Forecasting Methods Qualitative:primarily subjective;rely on judgment and opinion Time Series:use historical demand only Static ■Adaptive ■ Causal:use the relationship between demand and some other factor to develop forecast Simulation Imitate consumer choices that give rise to demand Can combine time series and causal methods SEIEE AU406 7-4
+ - SEIEE AU406 7-4 Forecasting Methods Qualitative: primarily subjective; rely on judgment and opinion Time Series: use historical demand only Static Adaptive Causal: use the relationship between demand and some other factor to develop forecast Simulation Imitate consumer choices that give rise to demand Can combine time series and causal methods
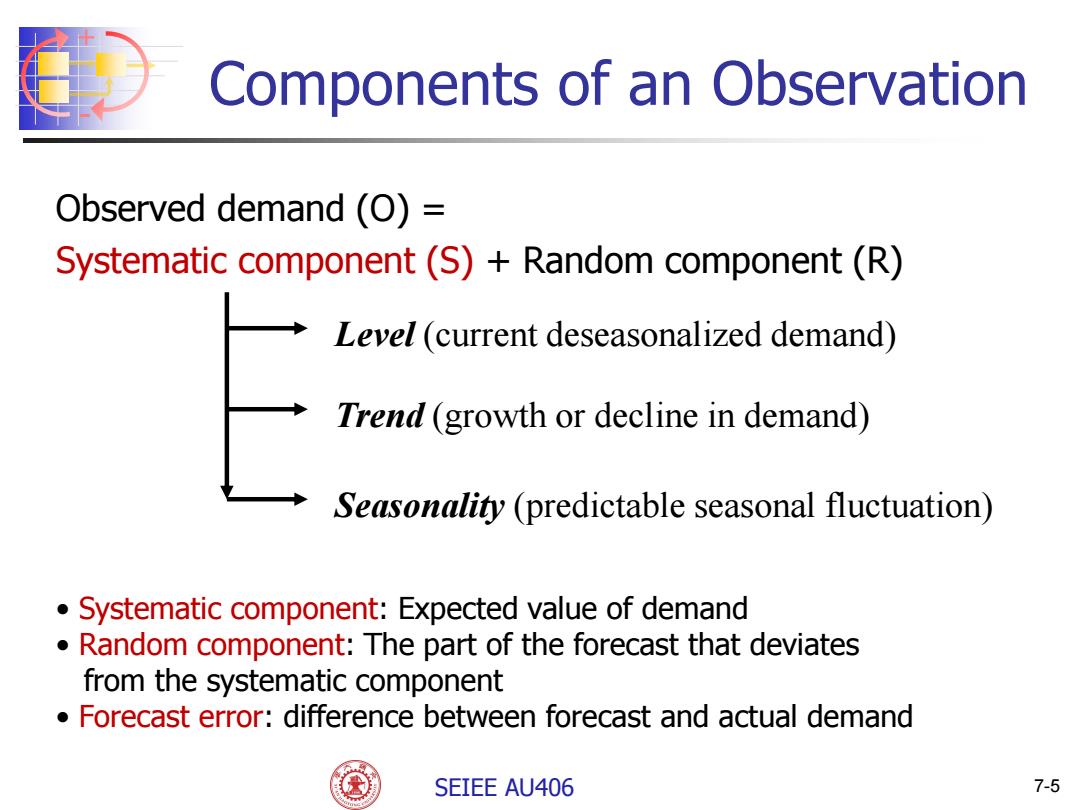
Components of an Observation Observed demand (O)= Systematic component(S)+Random component(R) Level (current deseasonalized demand) Trend (growth or decline in demand) Seasonality (predictable seasonal fluctuation) Systematic component:Expected value of demand Random component:The part of the forecast that deviates from the systematic component Forecast error:difference between forecast and actual demand SEIEE AU406 7-5
+ - SEIEE AU406 7-5 Components of an Observation Observed demand (O) = Systematic component (S) + Random component (R) Level (current deseasonalized demand) Trend (growth or decline in demand) Seasonality (predictable seasonal fluctuation) • Systematic component: Expected value of demand • Random component: The part of the forecast that deviates from the systematic component • Forecast error: difference between forecast and actual demand