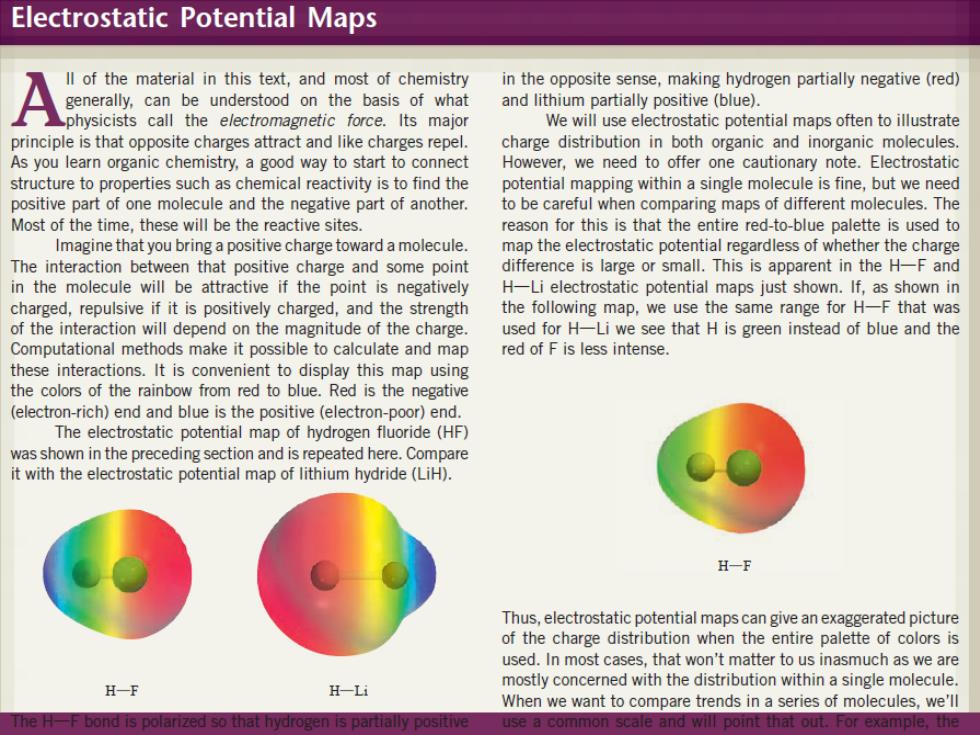
Electrostatic Potential Maps ll of the material in this text,and most of chemistry in the opposite sense,making hydrogen partially negative(red) generally,can be understood on the basis of what and lithium partially positive(blue). physicists call the electromagnetic force.Its major We will use electrostatic potential maps often to illustrate principle is that opposite charges attract and like charges repel. charge distribution in both organic and inorganic molecules As you learn organic chemistry,a good way to start to connect However,we need to offer one cautionary note.Electrostatic structure to properties such as chemical reactivity is to find the potential mapping within a single molecule is fine,but we need positive part of one molecule and the negative part of another. to be careful when comparing maps of different molecules.The Most of the time,these will be the reactive sites reason for this is that the entire red-to-blue palette is used to Imagine that you bring a positive charge toward a molecule. map the electrostatic potential regardless of whether the charge The interaction between that positive charge and some point difference is large or small.This is apparent in the H-F and in the molecule will be attractive if the point is negatively H-Li electrostatic potential maps just shown.If,as shown in charged,repulsive if it is positively charged,and the strength the following map,we use the same range for H-F that was of the interaction will depend on the magnitude of the charge. used for H-Li we see that H is green instead of blue and the Computational methods make it possible to calculate and map red of F is less intense. these interactions.It is convenient to display this map using the colors of the rainbow from red to blue.Red is the negative (electron-rich)end and blue is the positive (electron-poor)end. The electrostatic potential map of hydrogen fluoride(HF) was shown in the preceding section and is repeated here.Compare it with the electrostatic potential map of lithium hydride(LiH). H-F Thus,electrostatic potential maps can give an exaggerated picture of the charge distribution when the entire palette of colors is used.In most cases,that won't matter to us inasmuch as we are H一F H-Li mostly concerned with the distribution within a single molecule When we want to compare trends in a series of molecules,we'll The H-F bond is polarized so that hydrogen is partially positive use a common scale and will point that out.For example,the
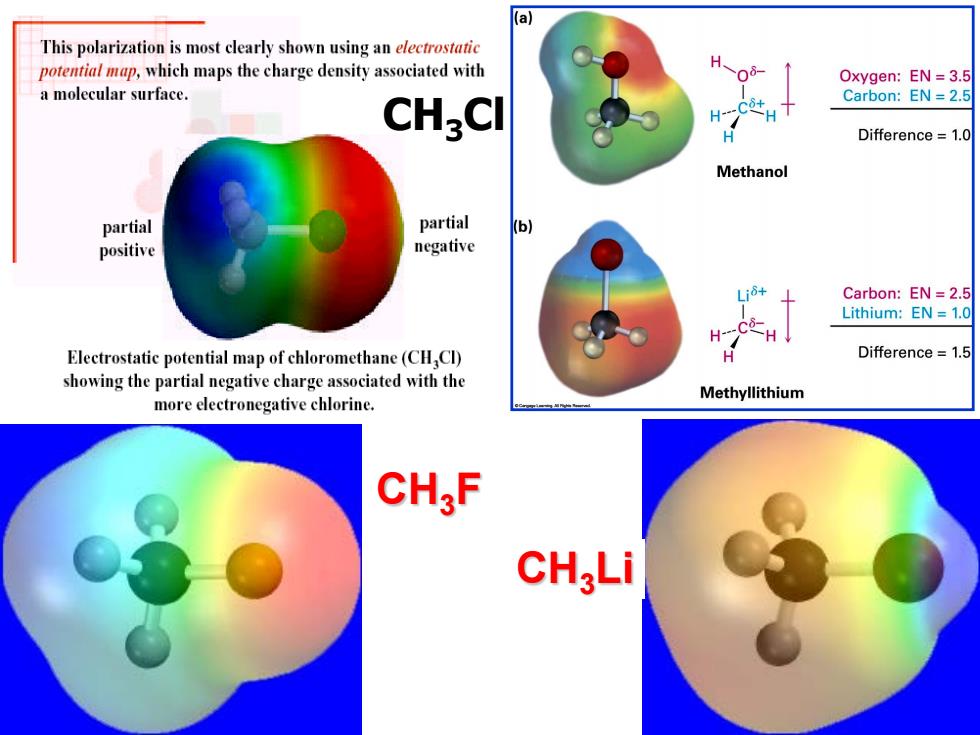
(a This polarization is most clearly shown using an electrostatic potential map,which maps the charge density associated with H Oxygen:EN=3.5 a molecular surface. Carbon:EN=2.5 CHgCl H---C+ Difference=1.0 Methanol partial partial (b) positive negative Carbon:EN =2.5 Lithium:EN 1.0 H Electrostatic potential map of chloromethane(CH Cl) Difference =1.5 showing the partial negative charge associated with the Methyllithium more electronegative chlorine. CH,F CH;Li
CH3Cl CH3F CH3Li
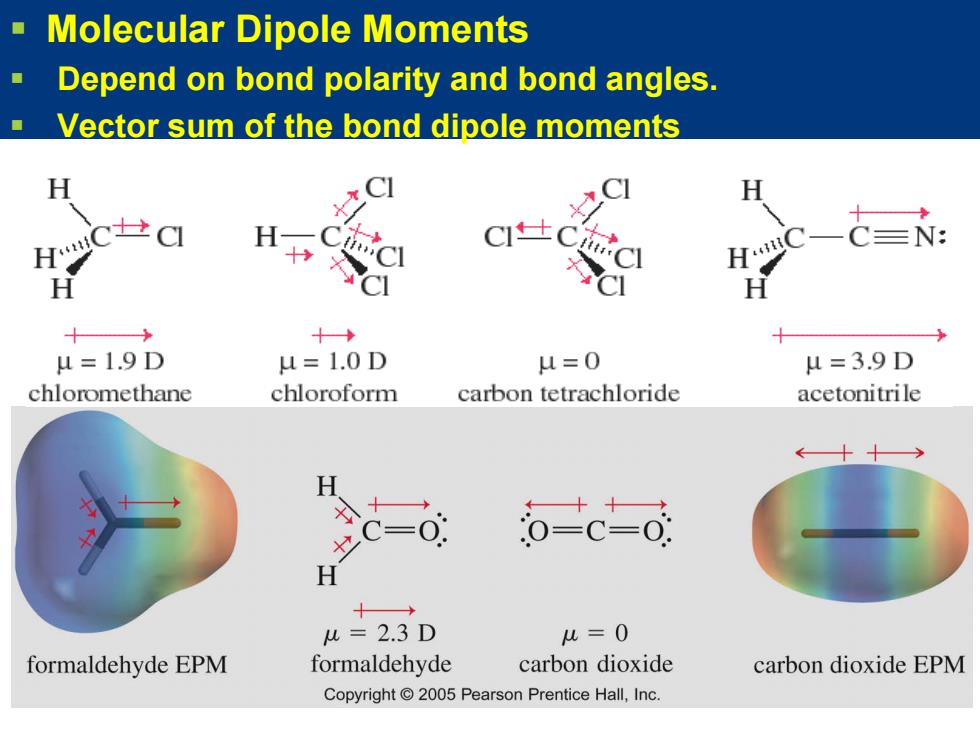
Molecular Dipole Moments Depend on bond polarity and bond angles. Vector sum of the bond dipole moments H CI CI H C=N: 十 H C】 CI 十 十→ u=1.9D u=1.0D u=0 u=3.9D chloromethane chloroform carbon tetrachloride acetonitrile H =0 o-c-o: H 十→ u=2.3D u=0 formaldehyde EPM formaldehyde carbon dioxide carbon dioxide EPM Copyright 2005 Pearson Prentice Hall,Inc
Molecular Dipole Moments Depend on bond polarity and bond angles. Vector sum of the bond dipole moments
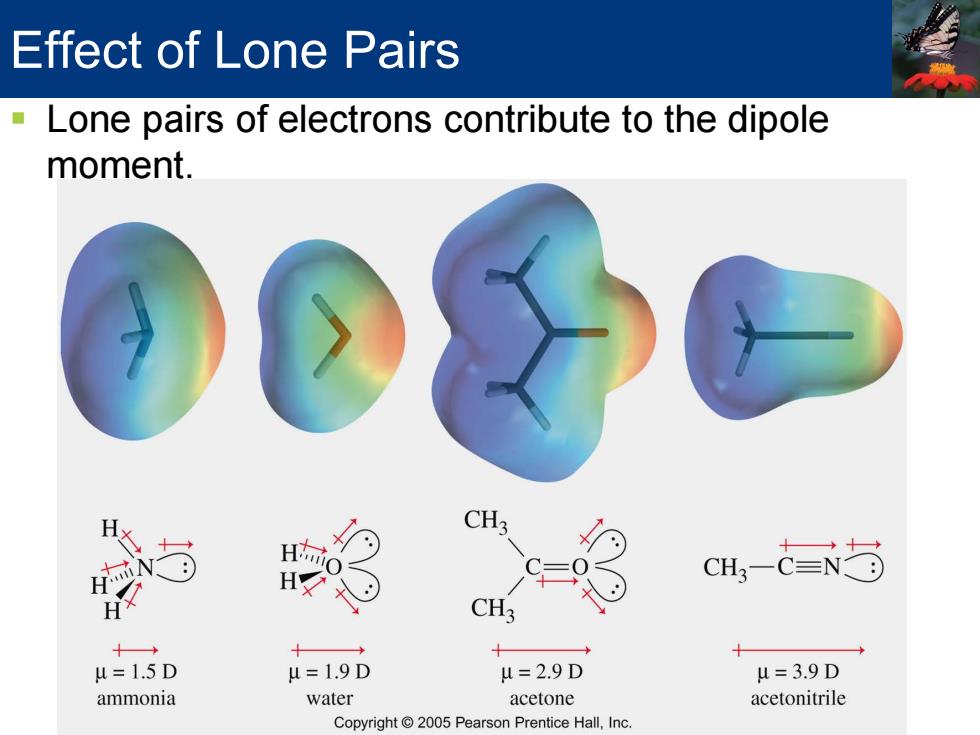
Effect of Lone Pairs Lone pairs of electrons contribute to the dipole moment. CH3 H c=9 CH,-N方 CH3 十→ + u=1.5D u=1.9D u=2.9D u=3.9D ammonia water acetone acetonitrile Copyright 2005 Pearson Prentice Hall,Inc
Effect of Lone Pairs Lone pairs of electrons contribute to the dipole moment
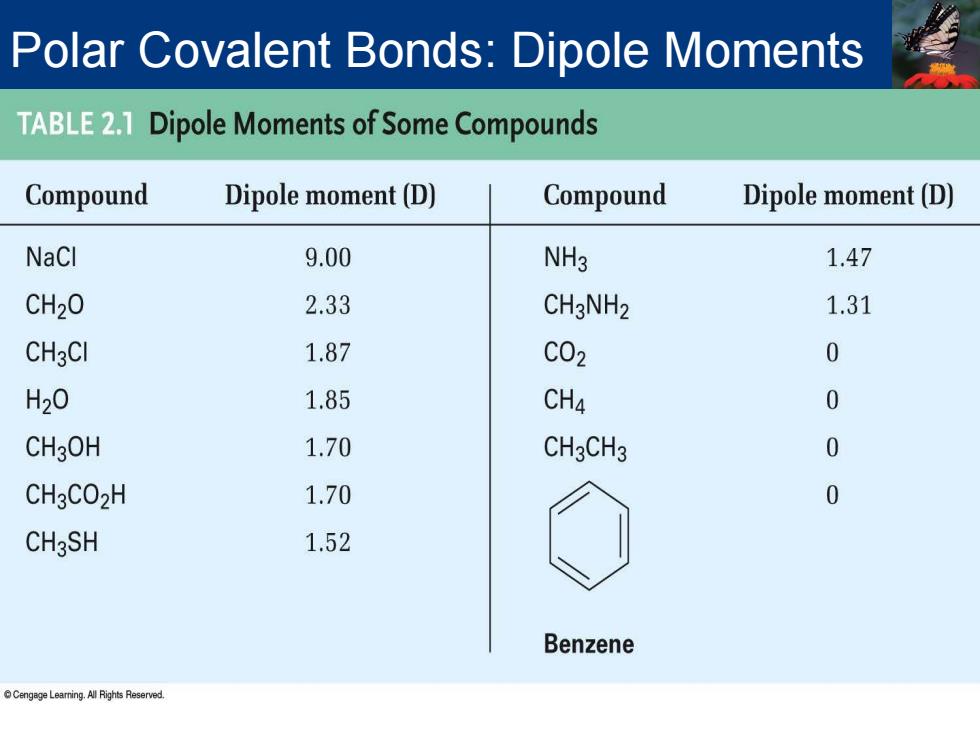
Polar Covalent Bonds:Dipole Moments TABLE2.1 Dipole Moments of Some Compounds Compound Dipole moment(D) Compound Dipole moment(D) NaCl 9.00 NH3 1.47 CH2O 2.33 CH3NH2 1.31 CH3CI 1.87 C02 0 H20 1.85 CH4 0 CH3OH 1.70 CH3CH3 0 CH3CO2H 1.70 0 CH3SH 1.52 Benzene enLeaming ARihts Reserved
Polar Covalent Bonds: Dipole Moments