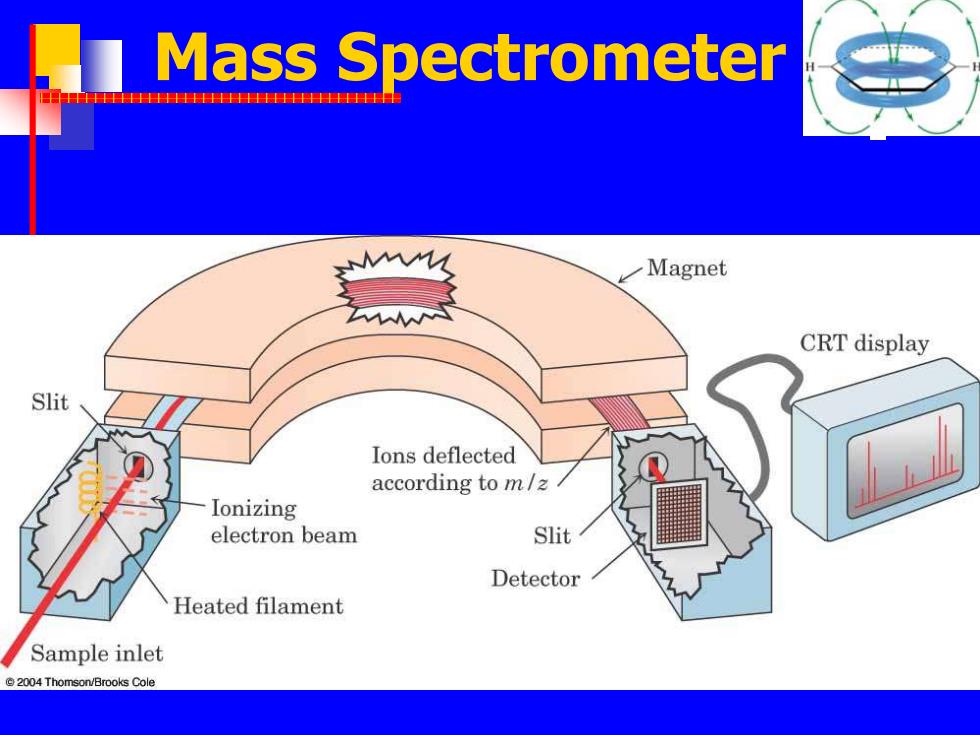
Mass Spectrometer 中P Magnet CRT display Slit Ions deflected according to m/z Ionizing electron beam Slit Detector Heated filament Sample inlet 2004 Thomson/Brooks Cole
Mass Spectrometer
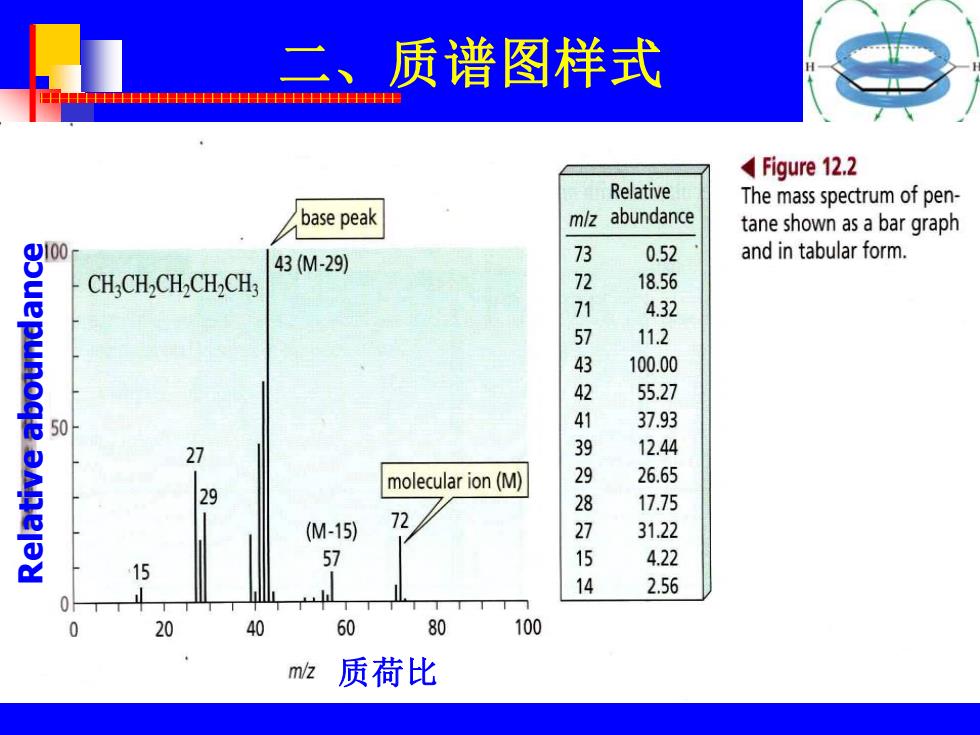
二、质谱图样式 Figure 12.2 Relative The mass spectrum of pen- base peak mlz abundance tane shown as a bar graph 100 43(M-29) 0.52 and in tabular form. CH.CH.CH.CH,CH: 7 18.56 4.32 11.2 43 100.00 55.27 50 4 37.93 27 12.44 molecular ion(M) 26.65 29 28 17.75 (M-15) 72 715 31.22 4.22 14 2.56 20 40 60 80 100 m/z 质荷比
二、质谱图样式 Relative aboundance 质荷比
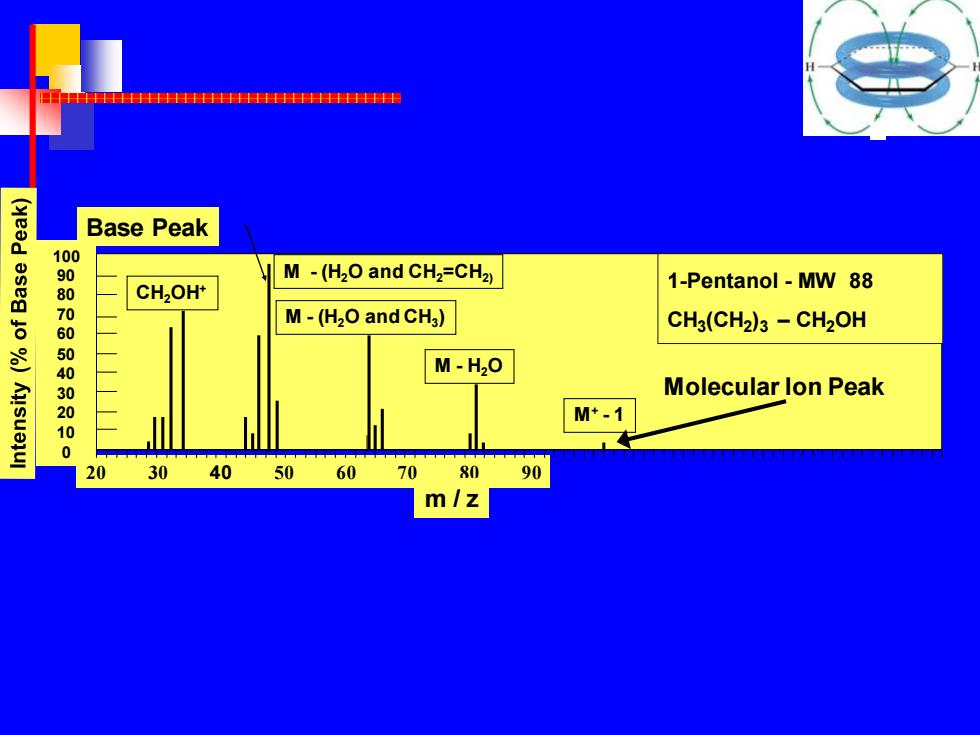
HTTHHHHHHHHHHHHHH1HHHHHHHHHHHHHHIF Base Peak 100 M-(H2O and CH2=CH2) 1-Pentanol-MW 88 80 CH2OH* 7 M-(H2O and CHg) CH3(CH2)3-CH2OH 050143020 M-H20 Molecular lon Peak M*-1 0 0 20 30 40 5060 70 80 90 m/z
100 90 80 70 60 50 40 30 20 10 0 20 30 40 50 60 70 80 90 m / z 1-Pentanol - MW 88 CH3 (CH2 )3 – CH2OH CH2OH+ M - (H2O and CH2=CH2) M - (H2O and CH3 ) M - H2O M+ - 1 Molecular Ion Peak Base Peak

Mass Spectrum 日中e Molecular ion the m/z value of the molecular ion gives the molecular weight of the compound Base peak ---is the one with the greatest intensity.it is assigned a relative intensity of 100% M+1 peak or M+2 peak ---often occurs because there are naturally isotopes of carbon,or other atoms
Mass Spectrum ❖Molecular ion ---- the m/z value of the molecular ion gives the molecular weight of the compound ❖Base peak ---- is the one with the greatest intensity. ( it is assigned a relative intensity of 100% ) ❖M+1 peak or M+2 peak ---- often occurs because there are naturally isotopes of carbon, or other atoms

Mass Spectrum 串 三、质谱在确定结构中的应用 确定分子量、分子式 冬—推导有机物分子结构
Mass Spectrum ❖三、质谱在确定结构中的应用 ❖——确定分子量、分子式 ❖——推导有机物分子结构