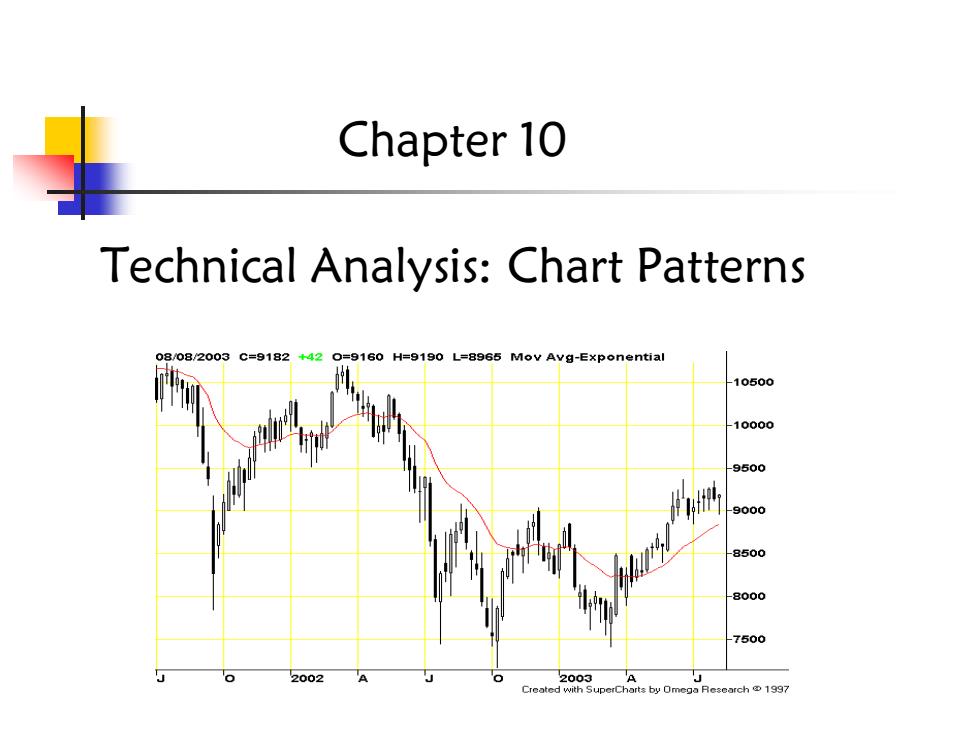
Chapter 10 Technical Analysis:Chart Patterns 08/082003C=918242 160 H=9190 L=8965 Mov Avg-Exponential 10500 10000 9500 9000 8500 8000 7500 2002 2003 Created with SuperCharts by Omega Research 1997
Technical Analysis: Chart Patterns Chapter 10
The Wave Theories R.N.Elliott pointed out that the stock market unfolds(展开)according to a basic rhythm or pattern of five waves up and three waves down to form a complete cycle of eight waves
The Wave Theories R.N. Elliott pointed out that the stock market unfolds(展开) according to a basic rhythm or pattern of five waves up and three waves down to form a complete cycle of eight waves
The pattern of five waves up followed by three waves down Corrective Impulsive 5 Phase Phase b a C 4
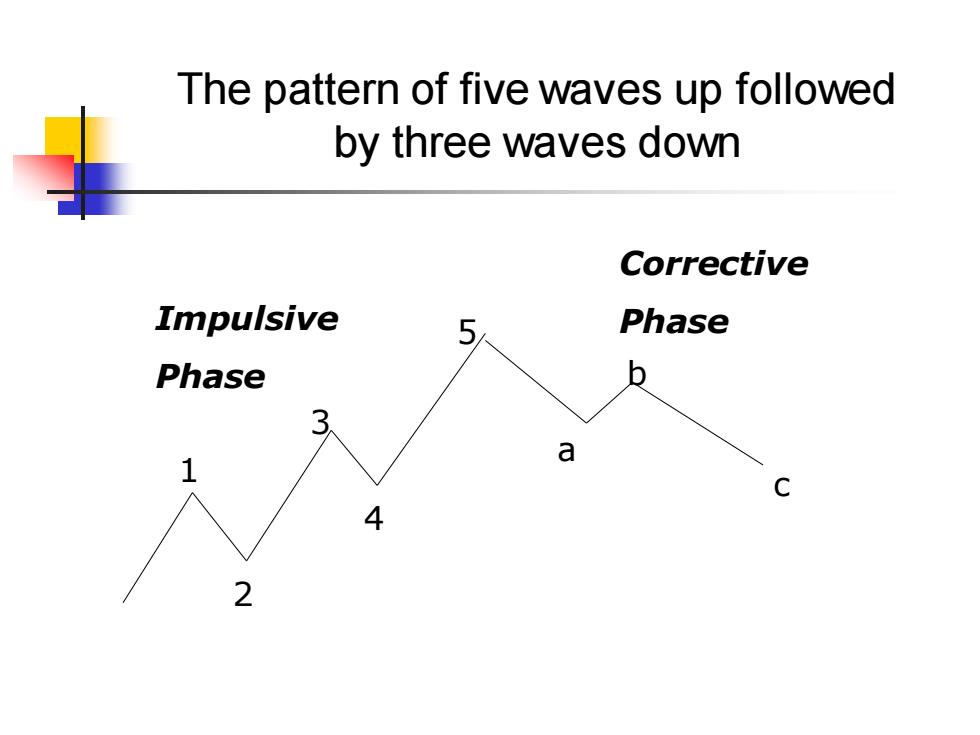
The pattern of five waves up followed by three waves down 1 2 3 4 5 b a c Impulsive Phase Corrective Phase
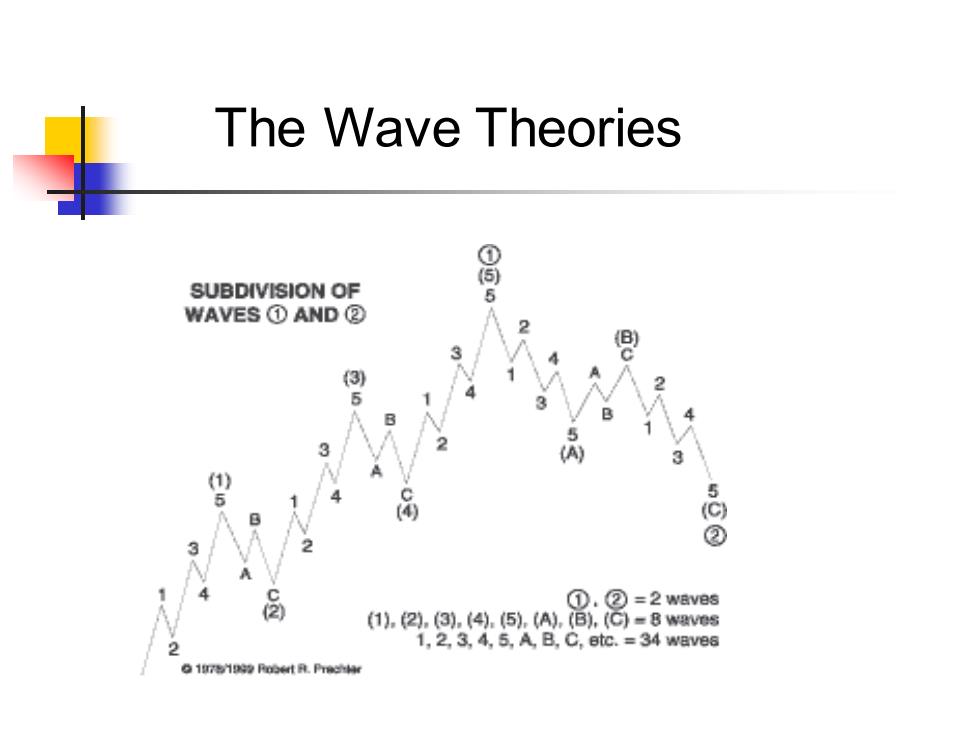
The Wave Theories SUBDIVISION OF 5 WAVES①AND② 2 3 恩 1 2 5 1 4 3 3 点 3 5 品 5 ② 3 2 ①.②=2wav8s (1).2.(3).(4).(5).(A).B).C)=8 waves 2 1,2,3,4,5,A,B.C,etc.=34 waves
The Wave Theories
The Bar Chart A price bar might represent a period as short as five minutes or as long as a month. The most common is the daily bar chart
The Bar Chart ◼ A price bar might represent a period as short as five minutes or as long as a month. ◼ The most common is the daily bar chart