The London Plan Mayor of London 27 figure 1.1 Londo lation change: ctual and projected (1986-2026) 9.000 18000 750 …A 50 source CApwo5MsmogaphicPoecdios.DMacBieting2o6/32 1.38 The new projections confirm that London's population is not only growing but its composition,particularly in terms of age structure and ethnicity. is changing markedly".The current projections confirm that London wil continue to be younger than the c a whole an est tha most si rent groups which make up London's population is included in Chapter 3A. 1.39 The impact of migration has had a rejuvenating effect on London's age structure;people moving to London tend to be young adults,such as students or first time employees,while those moving out are mostly older workers,retired people and young families.This impact is projected to increase as these trends continue over the next 20 years.Certain policies in this plan,pa igned to improv the arket 40 London's diversity is one of its great historical social,economic and cultural strengths and makes it one of the world's most multi-racial cities Over the six years to 2003 London received about two-thirds of the UK's net inflow of international migrants.Though at a lower rate than in the recent past,new arrivals will continue to contribute to London's diversity
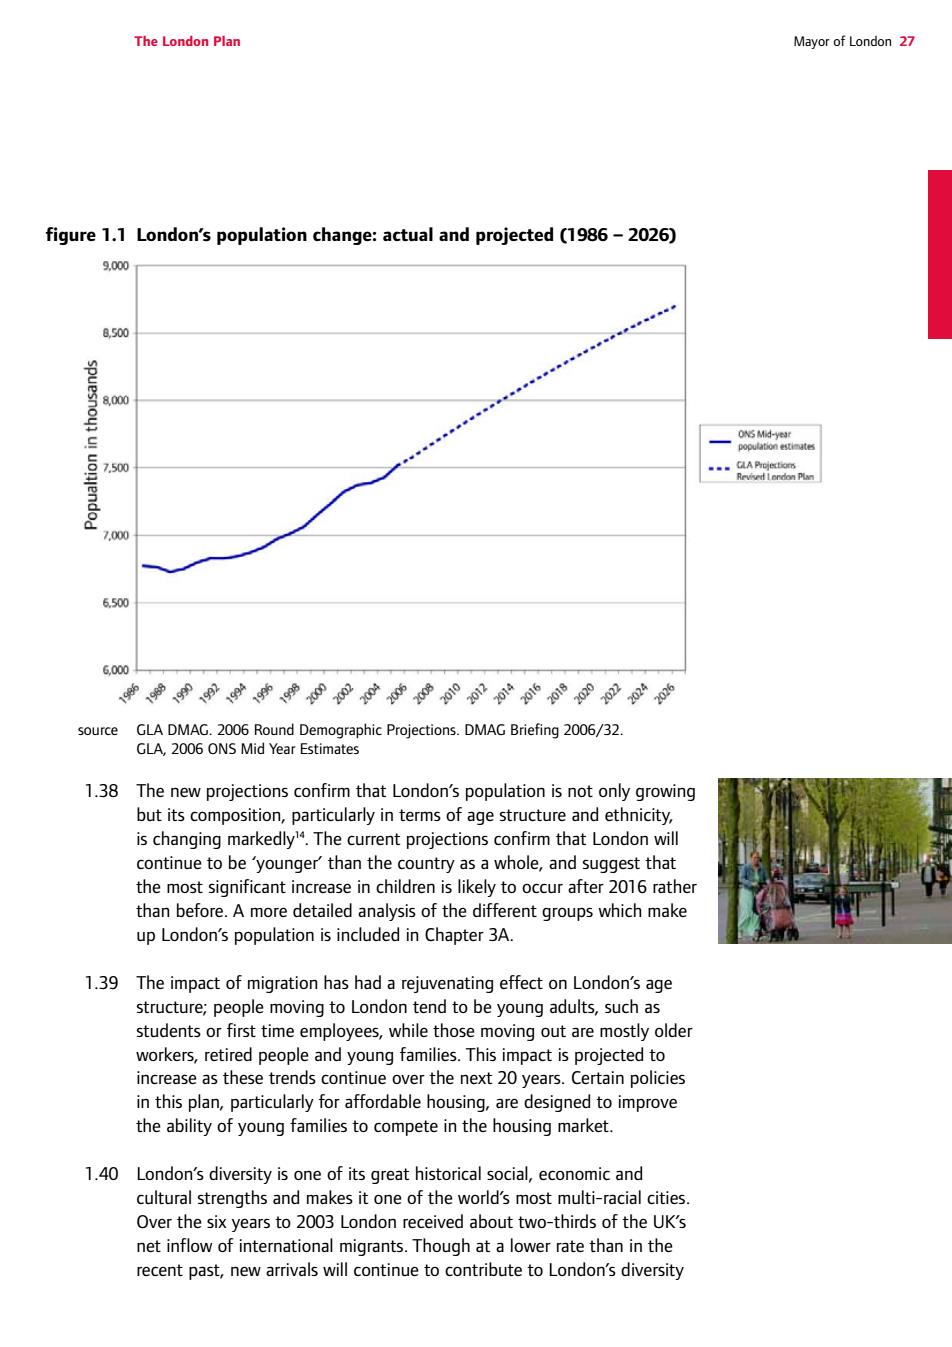
The London Plan Mayor of London 27 figure 1.1 London’s population change: actual and projected (1986 – 2026) source GLA DMAG. 2006 Round Demographic Projections. DMAG Briefing 2006/32. GLA, 2006 ONS Mid Year Estimates 1.38 The new projections confirm that London’s population is not only growing but its composition, particularly in terms of age structure and ethnicity, is changing markedly14. The current projections confirm that London will continue to be ‘younger’ than the country as a whole, and suggest that the most significant increase in children is likely to occur after 2016 rather than before. A more detailed analysis of the different groups which make up London’s population is included in Chapter 3A. 1.39 The impact of migration has had a rejuvenating effect on London’s age structure; people moving to London tend to be young adults, such as students or first time employees, while those moving out are mostly older workers, retired people and young families. This impact is projected to increase as these trends continue over the next 20 years. Certain policies in this plan, particularly for affordable housing, are designed to improve the ability of young families to compete in the housing market. 1.40 London’s diversity is one of its great historical social, economic and cultural strengths and makes it one of the world’s most multi-racial cities. Over the six years to 2003 London received about two-thirds of the UK’s net inflow of international migrants. Though at a lower rate than in the recent past, new arrivals will continue to contribute to London’s diversity
28 Mayor of Londor The London Plar minority groups such as Irish,Cypriot and Turkish communities. A significant growth in black and minority ethnic communities is projected over the next 20 years. 1.41 Together,these changes in the ethnic composition and age structure of the population by 2026 will have a major impact on the working-age population.Up to three quarters of the growth in the working age n black ntinue closely to monito -202 and its impact on black and minority ethnic group employment. Economic growth 1.42 The fundamental factor driving change in London's employment structure in the last 20 years has been the gain of 546,000 jobs in financial and business services and the loss of 292,000 jobs in manufacturing'5.After business services,the second main driver of job creation has been other ervices nated by the le services nd h linked to the iea6ep9nei的a 9 Most other sectors declined in employment (see Figure 1.2)
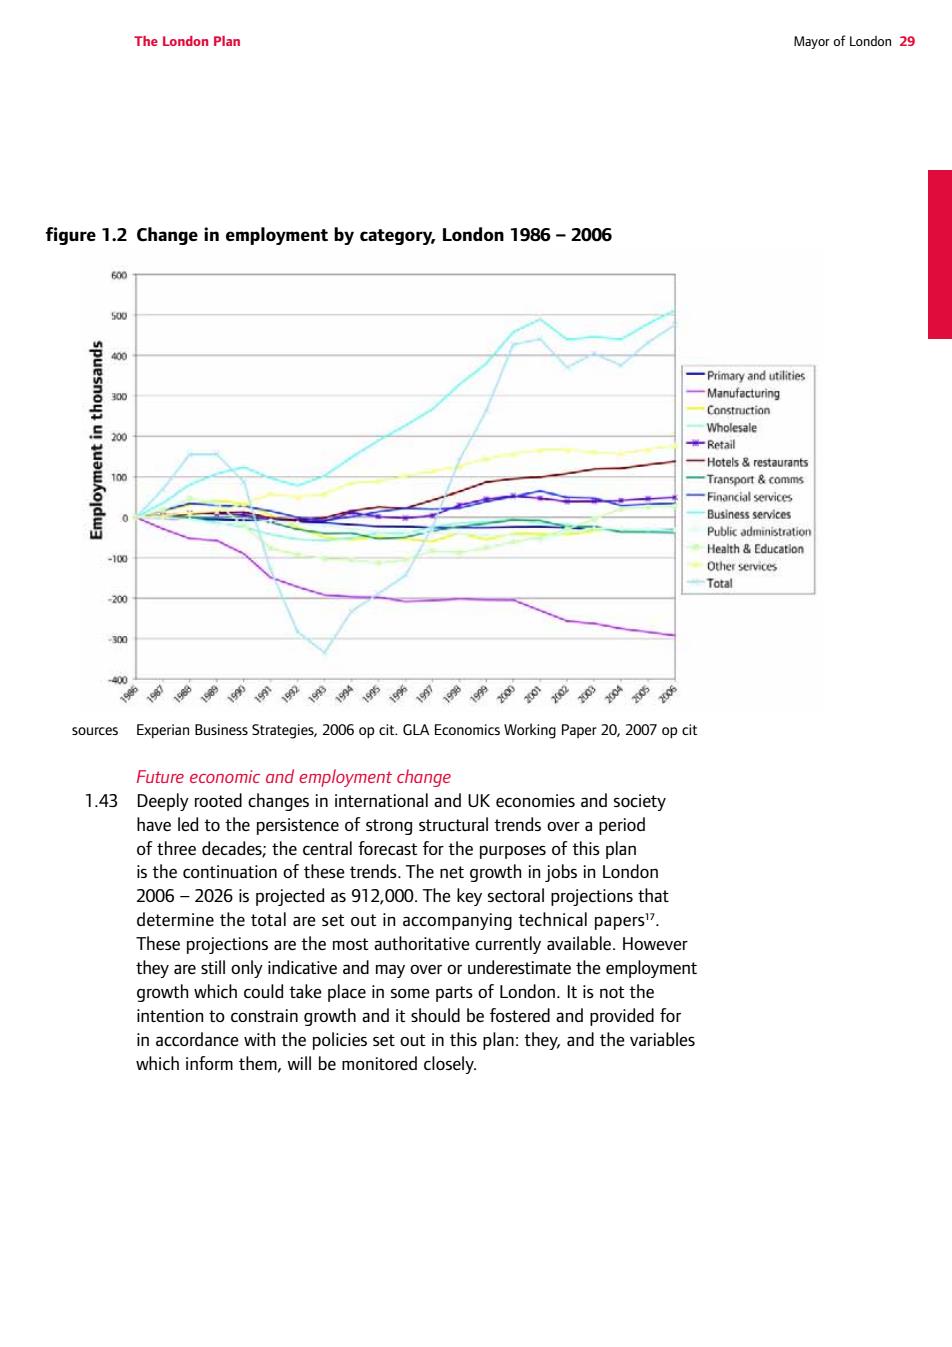
28 Mayor of London The London Plan and help maintain its youthful labour force. Over 40% of Londoners are from black and minority ethnic communities, including some mainly white minority groups such as Irish, Cypriot and Turkish communities. A significant growth in black and minority ethnic communities is projected over the next 20 years. 1.41 Together, these changes in the ethnic composition and age structure of the population by 2026 will have a major impact on the working-age population. Up to three quarters of the growth in the working age population will be drawn from black and minority ethnic groups. The Mayor will continue closely to monitor this in light of the 690,000 – 950,000 increase in the working age population projected for 2006 – 2026, and its impact on black and minority ethnic group employment. Economic growth 1.42 The fundamental factor driving change in London’s employment structure in the last 20 years has been the gain of 546,000 jobs in financial and business services and the loss of 292,000 jobs in manufacturing15. After business services, the second main driver of job creation has been other services, primarily dominated by the leisure and people-orientated services sector, and hotels and restaurants that are closely linked to the growth of tourism. The retail sector expanded significantly in the 1990s, following earlier losses, as did employment in health and education16. Most other sectors declined in employment (see Figure 1.2)
The London Plan Mayor of London2 figure 1.2 Cha nge mploym ent by category,London 1986-2006 mary and u ealth&Educatk Total sources Experian Business Strategies,2006 op cit.GLA Economics Working Paper 20,2007 op cit Future economic and employment change 1.43 Deeply rooted changes in international and UK economies and society have led to the persistence of strong structural trends over a period of three decades;the central forecast for the purposes of this plan is the continuation of these trends.The net growth in jobs in London 2006-2026 is projected as 912,000.The key sectoral projections that det rmine the total are set out in ac they are ative and may over or un intention to constrain growth and it should be fostered and provided for in accordance with the policies set out in this plan:they,and the variables which inform them,will be monitored closely
The London Plan Mayor of London 29 figure 1.2 Change in employment by category, London 1986 – 2006 sources Experian Business Strategies, 2006 op cit. GLA Economics Working Paper 20, 2007 op cit Future economic and employment change 1.43 Deeply rooted changes in international and UK economies and society have led to the persistence of strong structural trends over a period of three decades; the central forecast for the purposes of this plan is the continuation of these trends. The net growth in jobs in London 2006 – 2026 is projected as 912,000. The key sectoral projections that determine the total are set out in accompanying technical papers17. These projections are the most authoritative currently available. However they are still only indicative and may over or underestimate the employment growth which could take place in some parts of London. It is not the intention to constrain growth and it should be fostered and provided for in accordance with the policies set out in this plan: they, and the variables which inform them, will be monitored closely
30 Mayor of London The London Plar figure 1.3 Total employment,London 1986-2026 5750 370 9世书书书书书0pp书 sources Experian Business Strategies 2006 op cit.GLA Economics Working Paper 20 2007op cit figure 1.4 Financial and business services employment,London 1986-2026 25 中酚佛守矿e我刊我 ources Experian Business Strategies cit GLA Economics Working Paper cit
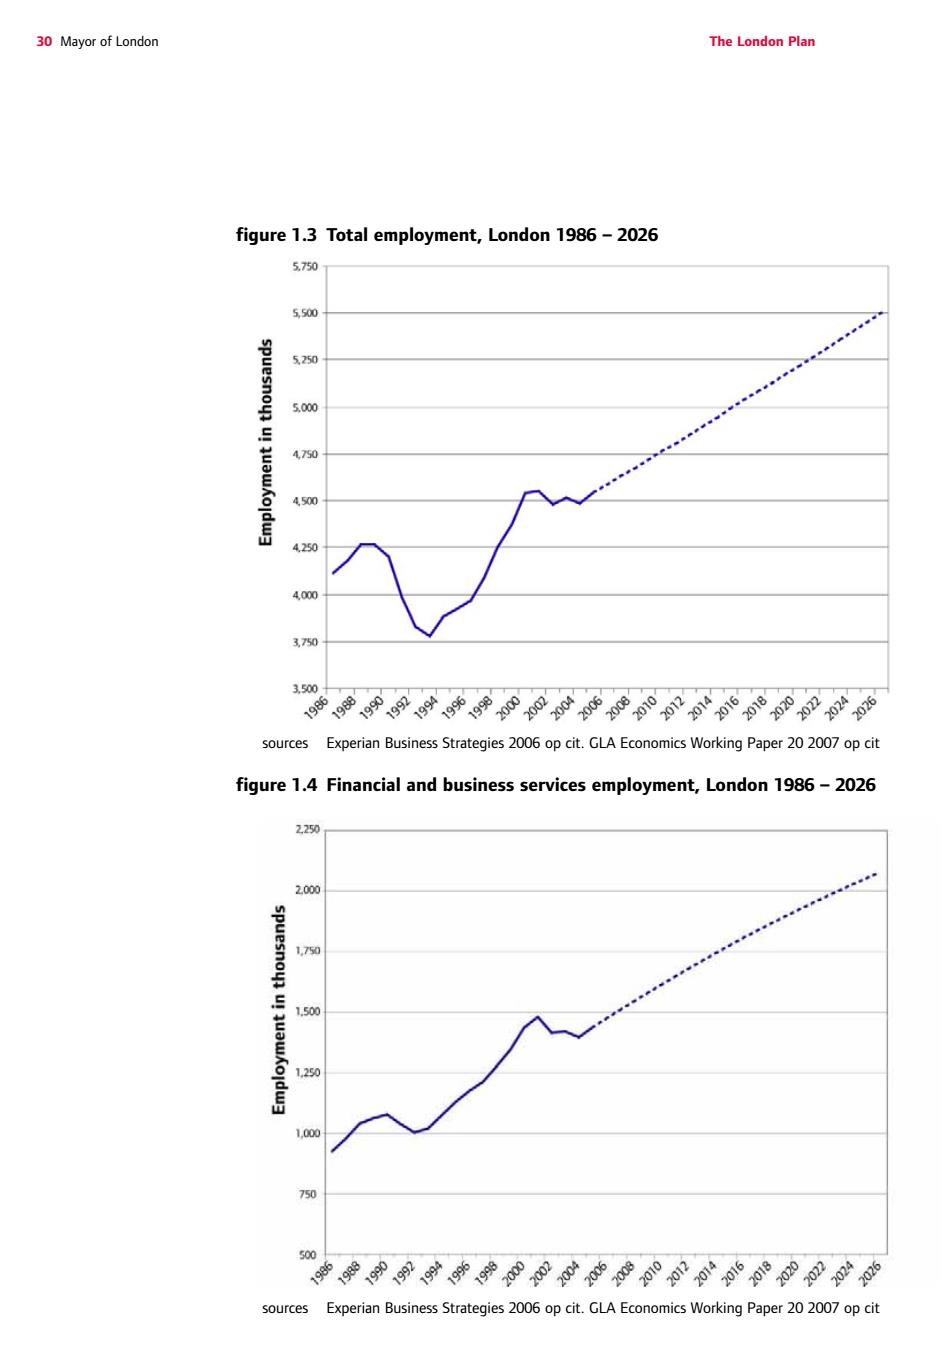
30 Mayor of London The London Plan figure 1.3 Total employment, London 1986 – 2026 sources Experian Business Strategies 2006 op cit. GLA Economics Working Paper 20 2007 op cit figure 1.4 Financial and business services employment, London 1986 – 2026 sources Experian Business Strategies 2006 op cit. GLA Economics Working Paper 20 2007 op cit
The London Plan Mayor of London3 1.44 The financeand business inthe structre of the globa openness anc This is particularly true of the international business part of the sector and its role in making markets and providing financial services in foreign currencies.The sector has accounted for 65 per cent of the job growth in London in the last 20 years and is the key economic sector in the city. 1.45 For structural reasons,the sector is projected to make the most significant contribution toecon nd60,0 further jos,6 of(se above) 1.46 The other major driver of jobs growth in London is people oriented services,particularly concentrated in the entertainment,leisure and retail industries.Unlike financial and business services,job growth in these sectors is not concentrated in the centre but is spread widely throughout London'(see Chapter 2).Between 1983 and 2003 these industries created 190,000 jobs in London.Projections indicate that these services will create an additional 314 000 iobs between 2006 and 2026.a further significantsect owth is in hotels a indu ias that are sm.High value-add ch as design,cre green industrie are projected to be important in those areas of London where manufacturing has been restructured and remains vibrant. 1.47 Conversely,primary/utilities and manufacturing sectors are expected to decline.So too is public administration,though the public sector as a whole remains the major employer in many outer parts of London- even though the London economy is driven much more by the private sector thar elsewhere in the country 1.48 The spatial implications of these issues are explored in Chapter 2 The implications for additional floor space requirements are set out in Chapter 3B. The environmental imperative 1.49 The environmental imperative is encapsulated by the Rio Summit, the Kyoto Agreement and a raft of EU and UK directives,standards and targets including that national Sustainable Development Strateqy In essence it means that London,which lags behind many other citie needs to consume few resources and to recycle more
The London Plan Mayor of London 31 1.44 The finance and business services sector stands out in the structure of the London economy owing to its exposure to increased global openness and technological change, its contribution to GDP and its ongoing dynamism. This is particularly true of the international business part of the sector and its role in making markets and providing financial services in foreign currencies. The sector has accounted for 65 per cent of the job growth in London in the last 20 years and is the key economic sector in the city. 1.45 For structural reasons, the sector is projected to make the most significant contribution to economic growth in London over the next 20 years with around 605,000 further jobs, 66 per cent of the net growth (see Figure 1.4 above). 1.46 The other major driver of jobs growth in London is people-oriented services, particularly concentrated in the entertainment, leisure and retail industries. Unlike financial and business services, job growth in these sectors is not concentrated in the centre but is spread widely throughout London18 (see Chapter 2). Between 1983 and 2003 these industries created 190,000 jobs in London. Projections indicate that these services will create an additional 314,000 jobs between 2006 and 2026. A further significant sector of growth is in hotels and catering – industries that are also strongly linked to tourism. High value-added activities such as design, creative and green industries are projected to be important in those areas of London where manufacturing has been restructured and remains vibrant. 1.47 Conversely, primary/utilities and manufacturing sectors are expected to decline. So too is public administration, though the public sector as a whole remains the major employer in many outer parts of London – even though the London economy is driven much more by the private sector than elsewhere in the country19. 1.48 The spatial implications of these issues are explored in Chapter 2. The implications for additional floor space requirements are set out in Chapter 3B. The environmental imperative 1.49 The environmental imperative is encapsulated by the Rio Summit, the Kyoto Agreement and a raft of EU and UK directives, standards and targets including that national Sustainable Development Strategy20. In essence it means that London, which lags behind many other cities, needs to consume fewer resources and to recycle more