22 Mayor of London The London Plar 1子s London's d inctive history has given it a unique set of spatial characteristics: It has grown as a relatively low-density,open city compared to other world cities and to most European capitals".Two-thirds of its land area and the majority of its population and workforce are in the suburbs. it has an attractive network of open and water spaces London has a well-established patter of centres varying in size es ommunitys activities, ments,such as Hampst or Richmond.The centre(the City,Westminster and surrounds) has always been an immensely powerful place of government, trade and culture and has been strongly influenced by international forces.This pattern of centres can be described as 'polycentric. It forms the basis for the network of centres of different scales identified in this plan and associated quidance in order to secure appropriate capacity at each scale to meet future demand and t cohesive and sustainable develc don's patterns ofg growth have he reate significant differenc the iy.For xample east London has been more industrial in character and,owing to 20th century industrial decline,has suffered greater problems of low income and social disadvantage than most areas in west London.London north of the river has historically accommodated the main centres of government,business and culture,compared to the more predominantly residential nature of south London. 1.28 Some of the historical spatial strengths of London have recently bee n ermined. For examp 。 the rapidgr n of out of c entre shopping and leisure developments has weakened its town centres 1.29 Lack of investment has failed to offer the quality of public transport needed to connect up its different areas,and especially to support the flows of workers from the residential areas to workplaces.This has resulted in increasing congestion,especially in the centre,and has inhibited sustainable growth.Many other elements of our Victorian infrastructure are wearina out and are inadequate to meet future needs Ifl has started to thie nd with investment alread und and substantial strategic and proposals for the future(see Para 3.220) more
22 Mayor of London The London Plan 2 London – past and present 1.27 London’s distinctive history has given it a unique set of spatial characteristics: • It has grown as a relatively low-density, open city compared to other world cities and to most European capitals11. Two-thirds of its land area and the majority of its population and workforce are in the suburbs. It has an attractive network of open and water spaces. • London has a well-established pattern of centres varying in size and function from the central area to local centres. Many of these centres have a long history as the focus of their community’s activities, often dating back to the original settlements, such as Hampstead or Richmond. The centre (the City, Westminster and surrounds) has always been an immensely powerful place of government, trade and culture and has been strongly influenced by international forces. This pattern of centres can be described as ‘polycentric’. It forms the basis for the network of centres of different scales identified in this plan and associated guidance12 in order to secure appropriate capacity at each scale to meet future demand and to support cohesive and sustainable development. • London’s patterns of growth have helped to create significant differences between the sub-regions of the city. For example, east London has been more industrial in character and, owing to 20th century industrial decline, has suffered greater problems of low income and social disadvantage than most areas in west London. London north of the river has historically accommodated the main centres of government, business and culture, compared to the more predominantly residential nature of south London. 1.28 Some of the historical spatial strengths of London have recently been undermined. For example, the rapid growth of out of centre shopping and leisure developments has weakened its town centres. 1.29 Lack of investment has failed to offer the quality of public transport needed to connect up its different areas, and especially to support the flows of workers from the residential areas to workplaces. This has resulted in increasing congestion, especially in the centre, and has inhibited sustainable growth. Many other elements of our Victorian infrastructure are wearing out and are inadequate to meet future needs. TfL has started to reverse this trend with a major programme of transport investment already underway and substantial strategic and more local proposals for the future (see Para 3.220)
The London Plan Mayor of London 23 rapic western and central parts of London.Recently it has begun to swing towards the inner east,but this trend has not yet reached boroughs in outer east London (see Map 1.1). 1.31 The geography of job creation in London has followed a consistent pattern for the last fifteen years(see Map1.2)with growth in financial and business service being concentrated in the centre and north west London.Othe services 1.32 Apattem of growth based on those services,including sectors such as retail,creative industries,computer-related activities and tourism, has emerged across inner and outer London over the last decade. However,there are several areas which have experienced relative decline(see Policy 2A.9)
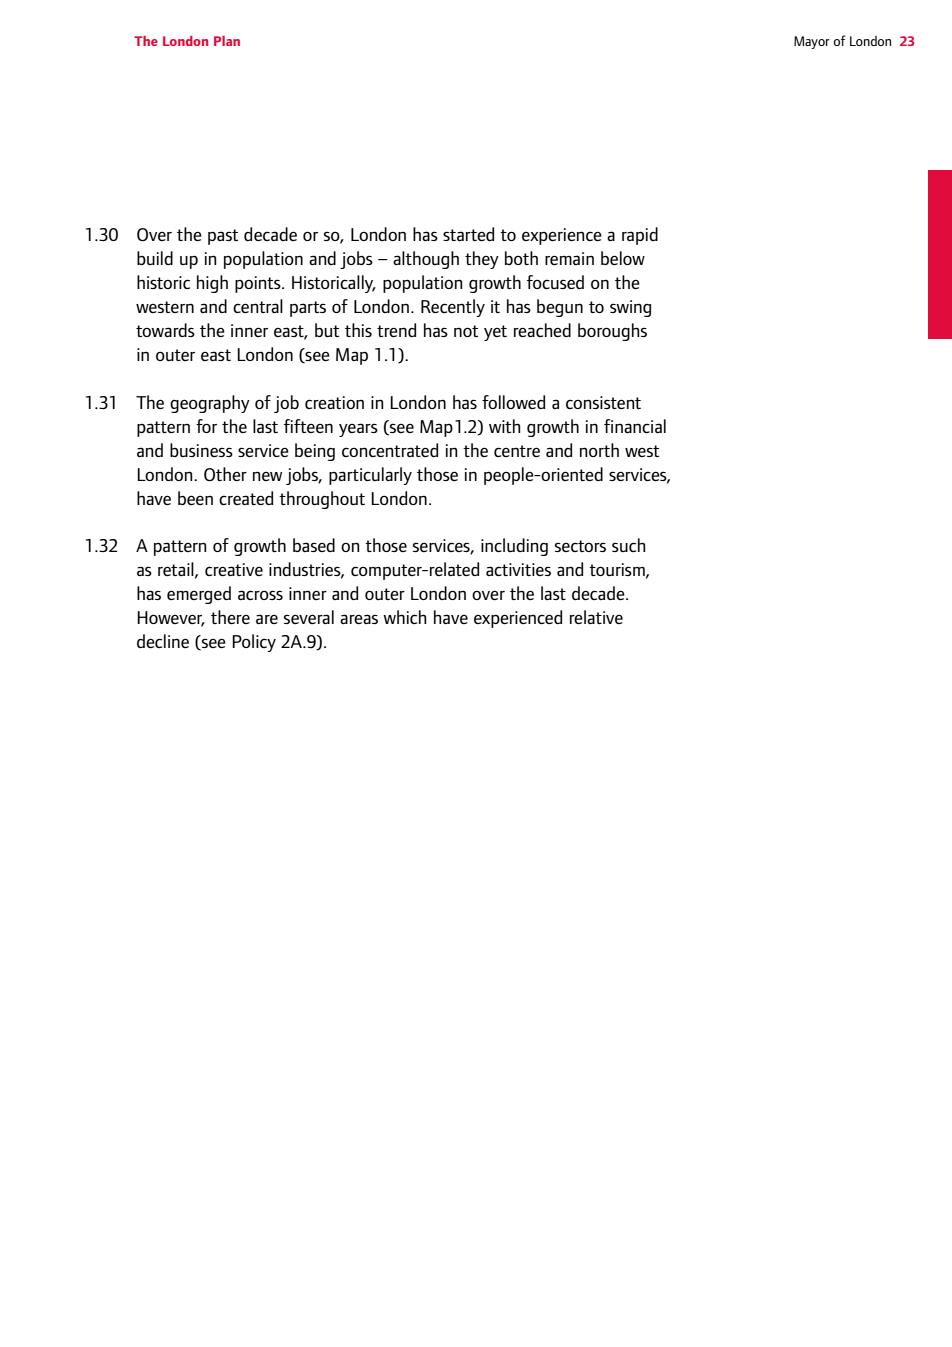
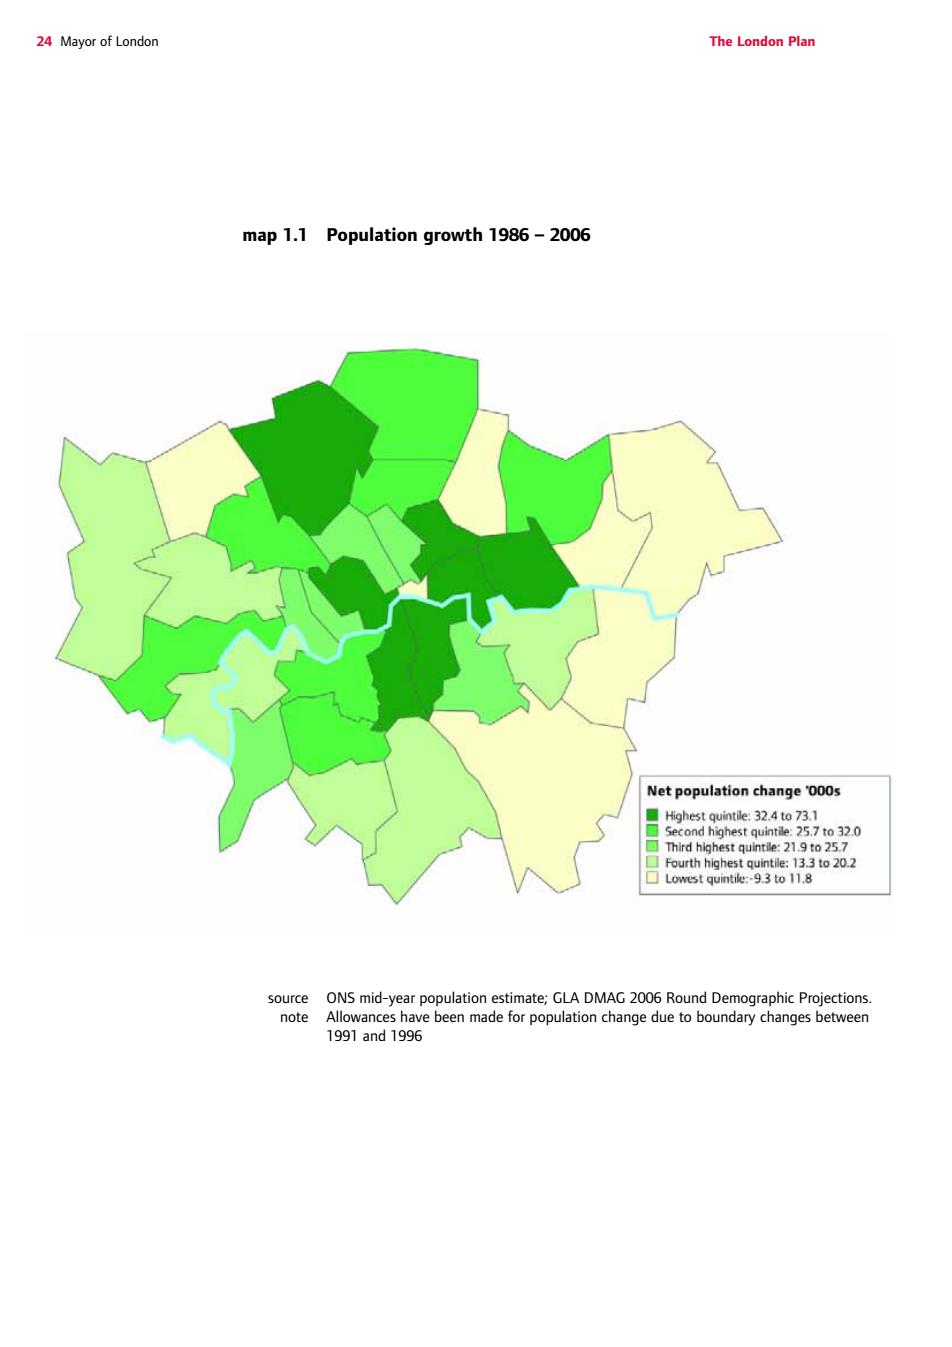
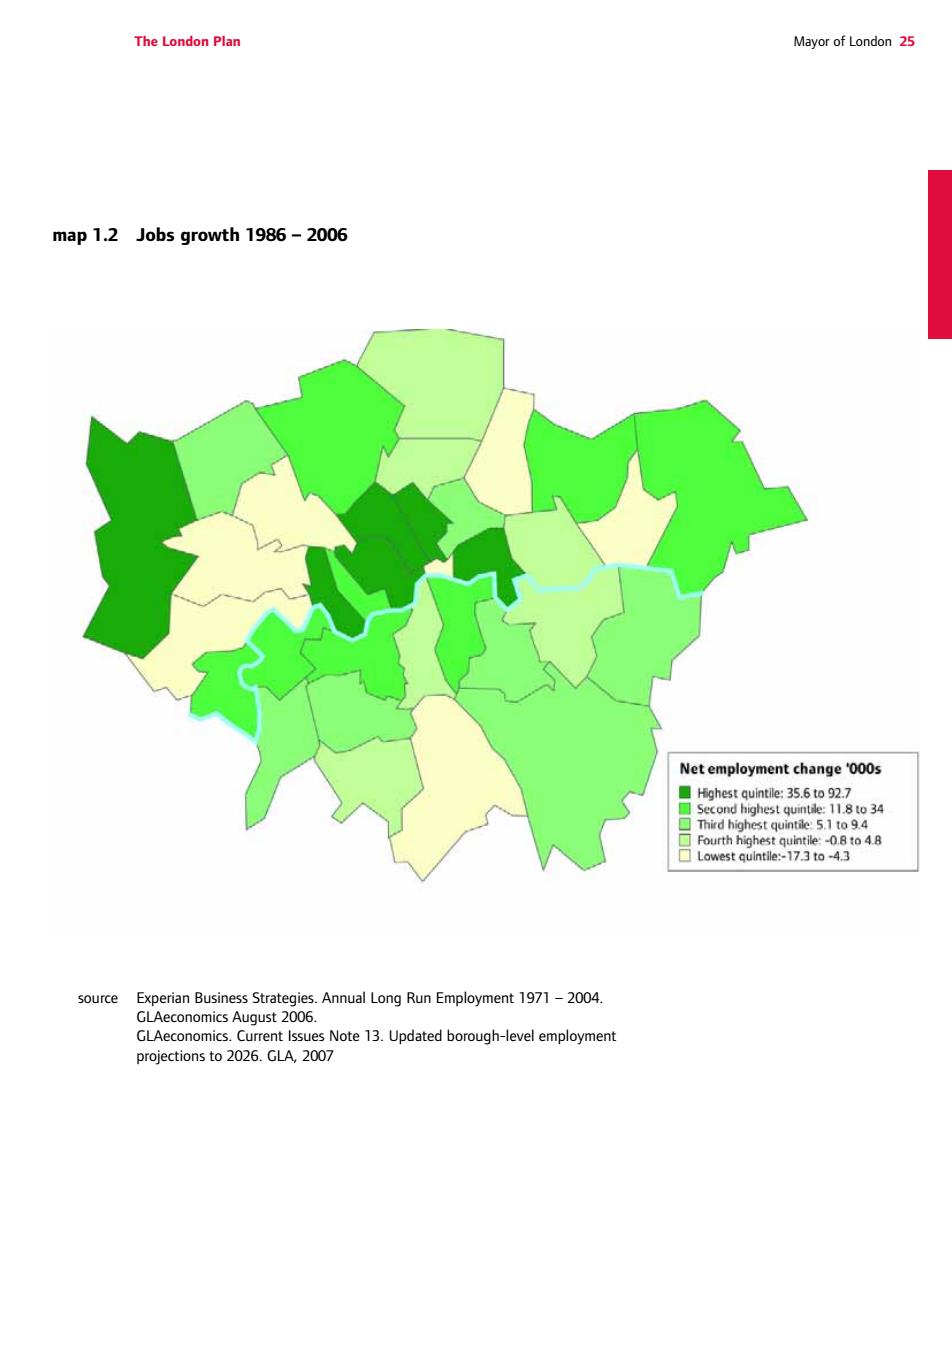
The London Plan Mayor of London 23 1.30 Over the past decade or so, London has started to experience a rapid build up in population and jobs – although they both remain below historic high points. Historically, population growth focused on the western and central parts of London. Recently it has begun to swing towards the inner east, but this trend has not yet reached boroughs in outer east London (see Map 1.1). 1.31 The geography of job creation in London has followed a consistent pattern for the last fifteen years (see Map1.2) with growth in financial and business service being concentrated in the centre and north west London. Other new jobs, particularly those in people-oriented services, have been created throughout London. 1.32 A pattern of growth based on those services, including sectors such as retail, creative industries, computer-related activities and tourism, has emerged across inner and outer London over the last decade. However, there are several areas which have experienced relative decline (see Policy 2A.9)
24 Mayor of London The London Plan map 1.1 Population growth 1986-2006 Net population change 000s 219 e ONS mid-v 1991and199e
24 Mayor of London The London Plan map 1.1 Population growth 1986 – 2006 source ONS mid-year population estimate; GLA DMAG 2006 Round Demographic Projections. note Allowances have been made for population change due to boundary changes between 1991 and 1996
The London Plan Mayor of London 25 map 1.2 Jobs growth 1986-2006 Net employment change 000s te:356to927 8o34 48 est au 73t0-43 source Experian Business Strategies.Annual Long Run Employment 1971-2004
The London Plan Mayor of London 25 map 1.2 Jobs growth 1986 – 2006 source Experian Business Strategies. Annual Long Run Employment 1971 – 2004. GLAeconomics August 2006. GLAeconomics. Current Issues Note 13. Updated borough-level employment projections to 2026. GLA, 2007
26 Mayor of London The London Plar 1.33 strategic importance that point to a new spatial emphasis in London. First,the bulk of recent investment in transport infrastructure has been in the east-the new A12,Channel Tunnel Rail link,Limehouse link, Jubilee Line Extension,Docklands Light Railway extension,A13 improvements etc.In addition,the impact of a unified Europe has altered the geography of trade.In the past London's main markets lay to the west and north where the bukothe UK O millon people tve Now theai arket potential to the east a nd south across the European n Unior covering a population over six times as great chng in London Looking to the future,this section examines six forces driving change in London.They are population growth,economic growth,environmental issues,lifestyle and technological changes and social justice.All of them have their roots in global changes,each with a particular London dimension, and they require a new and imaginative response from policy makers. The Mayor is committed to accommodating growth that is sustainable in the widest se nse.This roach to sustainable growth will be kept under review (see Chapter 6) Population growth 1.35 New projections for the London Plan confirm that there will be large changes both in the scale and nature of London's population over the next 20 years.The attraction of London as a place to work,study,live and visit is likely to continue-and in turn to place pressure on the supply of homes,workplaces,hotels,services,the environment and the transport system. venyd cached its peak of 8.6 million in 1939 but in a 1.36 d people fewer ion,London's population fell significantly to 6.8 million people by 1983.It has been arowing steadily since 1989. 1.37 In 2006,London's population was estimated to be 7.57 million people. The best current estimate of projected growth is a range,with that for 2016(7.94-8.19 million)only slightly different than anticipated in the 004 London Plan,rising to6-71million by(see Figure1.1 and Chapter 3A and Cha pter 5).The Mayor will continue to work with partners to refine these figures
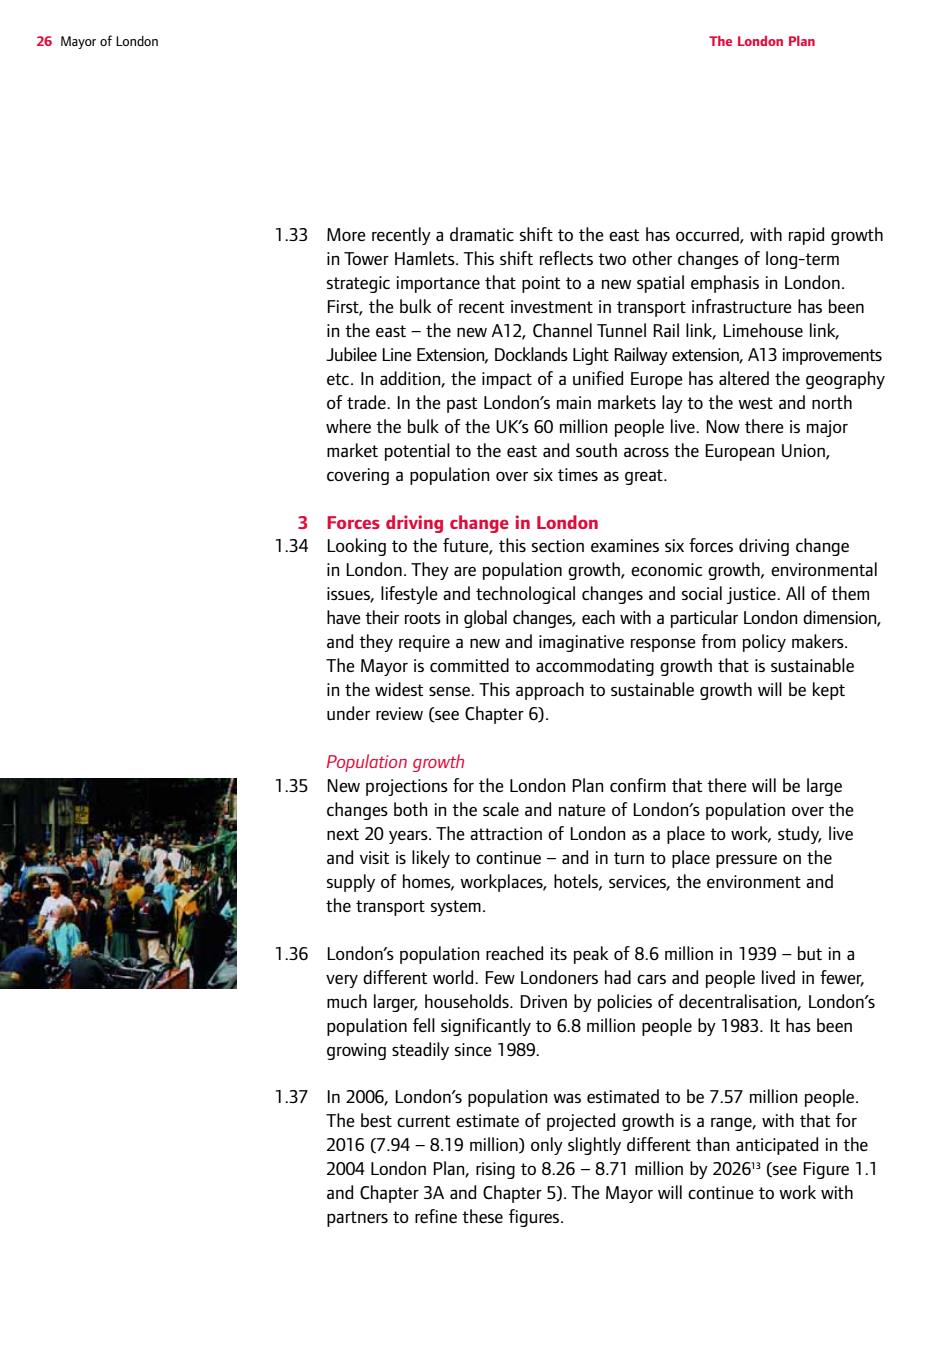
26 Mayor of London The London Plan 1.33 More recently a dramatic shift to the east has occurred, with rapid growth in Tower Hamlets. This shift reflects two other changes of long-term strategic importance that point to a new spatial emphasis in London. First, the bulk of recent investment in transport infrastructure has been in the east – the new A12, Channel Tunnel Rail link, Limehouse link, Jubilee Line Extension, Docklands Light Railway extension, A13 improvements etc. In addition, the impact of a unified Europe has altered the geography of trade. In the past London’s main markets lay to the west and north where the bulk of the UK’s 60 million people live. Now there is major market potential to the east and south across the European Union, covering a population over six times as great. 3 Forces driving change in London 1.34 Looking to the future, this section examines six forces driving change in London. They are population growth, economic growth, environmental issues, lifestyle and technological changes and social justice. All of them have their roots in global changes, each with a particular London dimension, and they require a new and imaginative response from policy makers. The Mayor is committed to accommodating growth that is sustainable in the widest sense. This approach to sustainable growth will be kept under review (see Chapter 6). Population growth 1.35 New projections for the London Plan confirm that there will be large changes both in the scale and nature of London’s population over the next 20 years. The attraction of London as a place to work, study, live and visit is likely to continue – and in turn to place pressure on the supply of homes, workplaces, hotels, services, the environment and the transport system. 1.36 London’s population reached its peak of 8.6 million in 1939 – but in a very different world. Few Londoners had cars and people lived in fewer, much larger, households. Driven by policies of decentralisation, London’s population fell significantly to 6.8 million people by 1983. It has been growing steadily since 1989. 1.37 In 2006, London’s population was estimated to be 7.57 million people. The best current estimate of projected growth is a range, with that for 2016 (7.94 – 8.19 million) only slightly different than anticipated in the 2004 London Plan, rising to 8.26 – 8.71 million by 202613 (see Figure 1.1 and Chapter 3A and Chapter 5). The Mayor will continue to work with partners to refine these figures