
Examples of effect of substrate limiting compound on the yield coefficient for biomass per glucose(Yx/glucose) limiting substrate Glucose Ammonia Phosphate Sulphate Potassium Bacillus subtilis 0.39 0.18 0.27 0.12 E.coli 0.40 0.26 Klebsiella aerogenes 0.45 0.16 0.15 0.19 0.09
Examples of effect of substrate limiting compound on the yield coefficient for biomass per glucose (Yx/glucose) limiting substrate Glucose Ammonia Phosphate Sulphate Potassium Bacillus subtilis 0.39 0.18 0.27 0.12 E.coli 0.40 0.26 Klebsiella aerogenes 0.45 0.16 0.15 0.19 0.09

S L=Mmax S+Ks Examples of reported Ks values for microbial growth Organism Substrate Ks(mg/L) S.cerevisiae Glucose 50 E.coli Glucose 5 E.coli Lactose 20 E.coli Tryptophan 0.001 E.coli Phosphate 1.6 Aspergillus Glucose 5 Candida Oxygen 0.04 Pseudomonas Methanol 0.7 Cryptococcus Thiamice 10-7
Examples of reported Ks values for microbial growth S Ks S + = max Organism Substrate Ks(mg/L) S.cerevisiae Glucose 50 E.coli Glucose 5 E.coli Lactose 20 E.coli Tryptophan 0.001 E.coli Phosphate 1.6 Aspergillus Glucose 5 Candida Oxygen 0.04 Pseudomonas Methanol 0.7 Cryptococcus Thiamice 10-7

The temperature dependence of growth and substrate consumption is usually described with Arrhenius equation Lmm=Ae△ERT 0.5 0 .10 -0.5 10 3.2 3.3 3.425 35 45 I/T (K-l) T(C) The influence of temperature on growth and energy substrate consumption. Left:Effect of temperature on the growth rate according to the Arrhenius model Curve A represents the growth yielding reactions and curve B represents the death eaction,which has a larger activation energy(slope).Curve C is the resulting cell growth rate.Right:Effect of temperature on gs for glucose and u in a pH-auxostat cultivation of E.coli
The temperature dependence of growth and substrate consumption is usually described with Arrhenius equation μmax=A e -△E/RT
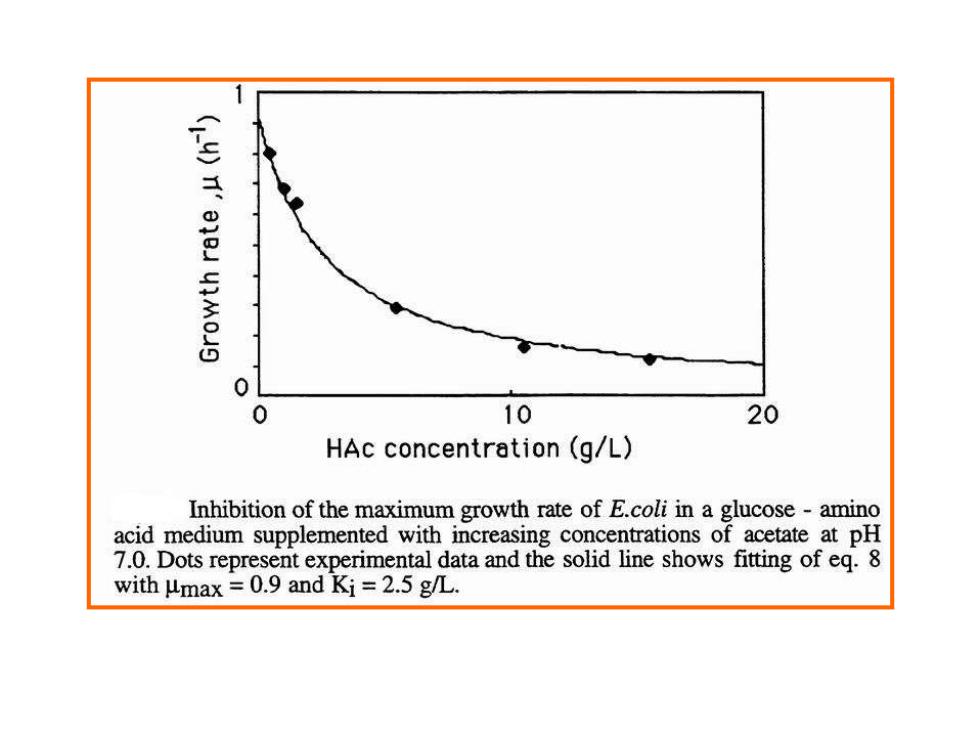
0 0 10 20 HAc concentration(g/L) Inhibition of the maximum growth rate of E.coli in a glucose-amino acid medium supplemented with increasing concentrations of acetate at pH 7.0.Dots represent experimental data and the solid line shows fitting of eq.8 with umax =0.9 and Ki=2.5 g/L