UNCIL C Council of Graduate Schools GRADUATE SCHIOOLS Advocacy,Research,and Innovation Ph.D.Completion and Attrition: Analysis of Baseline Data Robert Sowell NSF Workshop A FRESH LOOK AT Ph.D.EDUCATION March 31,2008
Ph. D. Completion and Attrition: Analysis of Baseline Data Robert Sowell NSF Workshop A FRESH LOOK AT Ph.D. EDUCATION March 31, 2008

CGS Ph.D.Completion Project Quantitative Data Submitted by Institutions 12 Years(1992-93 through2003-04) Program completion Broad field demographic and attrition completion ·30 Institutions ·Gender(G) ·5 Broad Fields Citizenship/Ethnicity (CE) ·54 Disciplines ·24 Institutions(G) ·330 Programs ·23 Institutions(CE) ·~49,000 Students ·~40,000 Students(G) .~40,000 Students (CE) OUNCIL Council of Graduate Schools
CGS Ph.D. Completion Project Quantitative Data Submitted by Institutions 12 Years (1992-93 through 2003-04) Program completion and attrition • 30 Institutions • 5 Broad Fields • 54 Disciplines • 330 Programs • ~49,000 Students Broad field demographic completion • Gender (G) • Citizenship/Ethnicity (CE) • 24 Institutions (G) • 23 Institutions (CE) • ~40,000 Students (G) • ~ 40,000 Students (CE)
Ten-Year Completion and Attrition Analysis: For Students Entering Ph.D.Programs 1992-93 through 1994-95 (A Cohorts) Completion Program Data:Overall,broad field,discipline Gender Data:Broad field Citizenship/Ethnicity:Broad field Attrition Program Data:Overall,broad field COUNCIL C Council of Graduate Schools
Ten-Year Completion and Attrition Analysis: For Students Entering Ph.D. Programs 1992-93 through 1994-95 (A Cohorts) Completion • Program Data: Overall, broad field, discipline • Gender Data: Broad field • Citizenship/Ethnicity: Broad field Attrition • Program Data: Overall, broad field
Profile of Data (A-Cohorts)for Ten-Year Completion Analysis Program Data 12,135 Approximate distribution across fields Gender Data 9,683 17% 19% Citizenship& Ethnicity Data 9,359 □ Engineering 12% 21% ☐Life Sciences ☐Math&Physical Sci.. ☐Social Sciences 31% ■Humanities OUNCIL Council of Graduate Schools
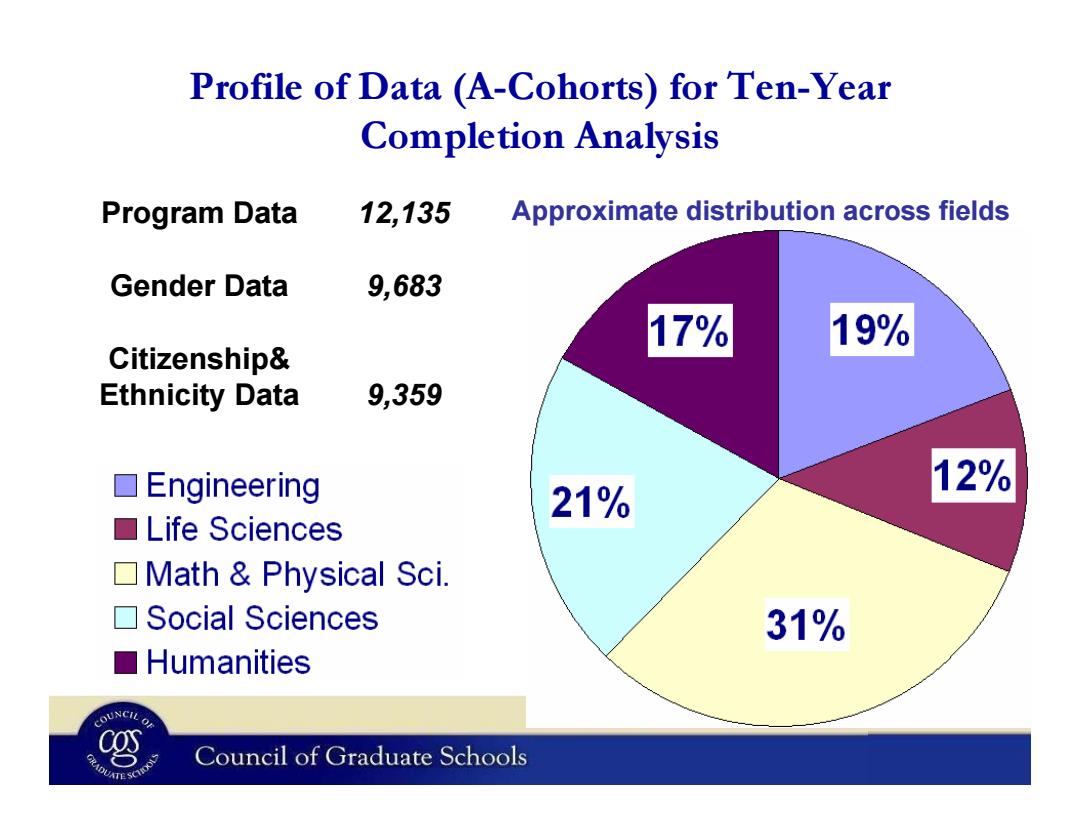
Profile of Data (A-Cohorts) for Ten-Year Completion Analysis Approximate distribution across fields 9,359 Citizenship& Ethnicity Data Gender Data 9,683 Program Data 12,135

Overall Ten-Year Completion Rates 品 57 55 51 46 导 36 23 8 11 5 3 4 5 6 8 9 10 Source:Council of Graduate Schools Completion and Attrition Program Data Council of Graduate Schools
Overall Ten-Year Completion Rates 5 11 23 36 46 51 55 57 0 20 40 60 Cumulative Completion Rate (%) 3 4 5 6 7 8 9 10 Source: Council of Graduate Schools Completion and Attrition Program Data