Section 5.2 Quantitative Tuning of H2 PID Controllers 3.0 2.5 2.0 1.5 1.0 0.0 0.2 0.4 0.6 0.8 1.0 12 /0 Figure:Relationship between the performance degree and the rise time 4口,4@4主4生定分QC Zhang.W.D..CRC Press.2011 Version 1.0 13/78
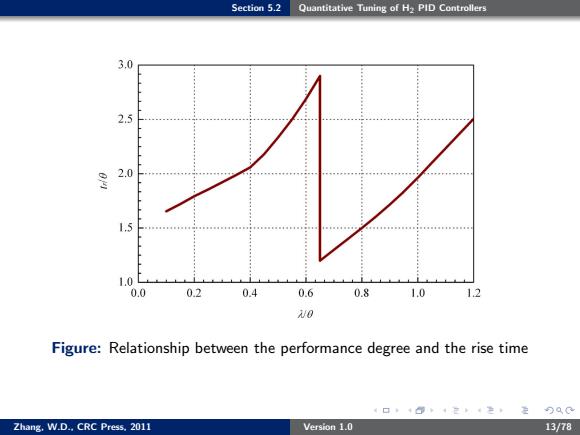
Section 5.2 Quantitative Tuning of H2 PID Controllers Figure: Relationship between the performance degree and the rise time Zhang, W.D., CRC Press, 2011 Version 1.0 13/78
Section 5.2 Quantitative Tuning of H2 PID Controllers 0 0.0 03 0.6 0.9 1.2 /0 Figure:Relationship between the performance degree and the resonance peak e.g,2dB->λ=0.220 4口,+@,4定4定90C Zhang.W.D..CRC Press.2011 Version 1.0 14/78
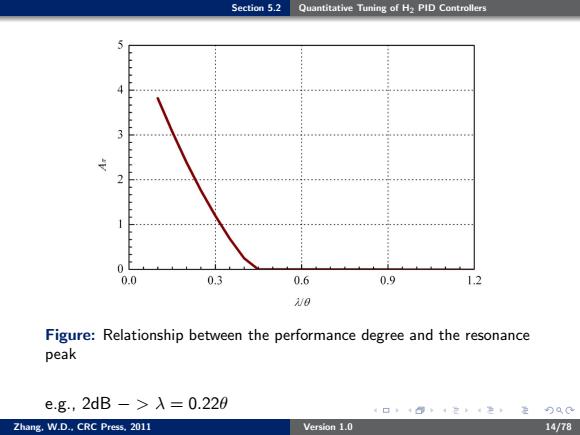
Section 5.2 Quantitative Tuning of H2 PID Controllers Figure: Relationship between the performance degree and the resonance peak e.g., 2dB − > λ = 0.22θ Zhang, W.D., CRC Press, 2011 Version 1.0 14/78
Section 5.2 Quantitative Tuning of H2 PID Controllers 1.0 0.8 0.6 0.4 0.2 2.0 1.5 1.0 020g06081012 a以 0.5 Figure:Relationship between the performance degree and the perturbation peak 4口+@,4定4生定9QC Zhang,W.D..CRC Press.2011 Version 1.0 15/78
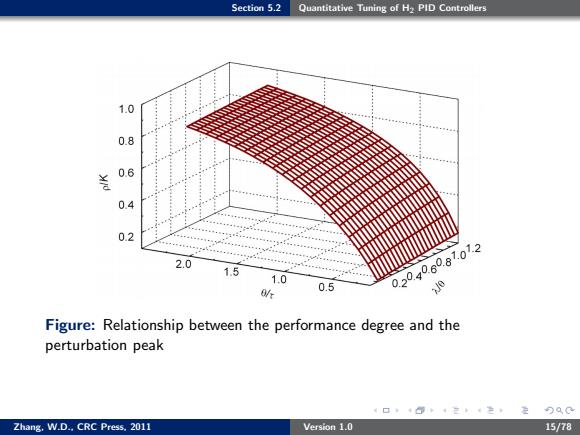
Section 5.2 Quantitative Tuning of H2 PID Controllers Figure: Relationship between the performance degree and the perturbation peak Zhang, W.D., CRC Press, 2011 Version 1.0 15/78
Section 5.2 Quantitative Tuning of H2 PID Controllers 10 =0.36 =0.8 10 10 10 10 Frequency(rad/s) -180 -360 540 -720 10 10 10 Frequency(rad/s) Figure:Bode plot of the H2 PID control system 4口,4@4定42:定90C Zhang,W.D..CRC Press.2011 Version 1.0 16/78
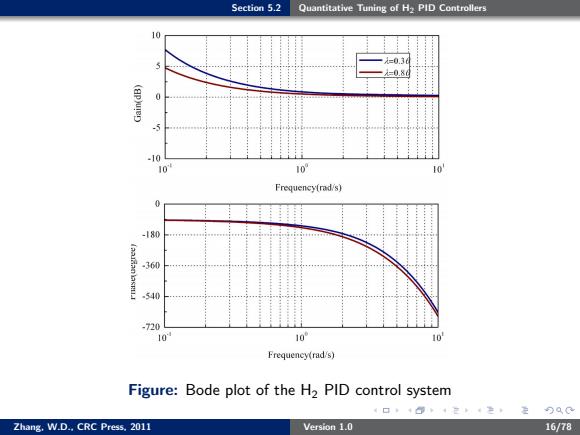
Section 5.2 Quantitative Tuning of H2 PID Controllers Figure: Bode plot of the H2 PID control system Zhang, W.D., CRC Press, 2011 Version 1.0 16/78
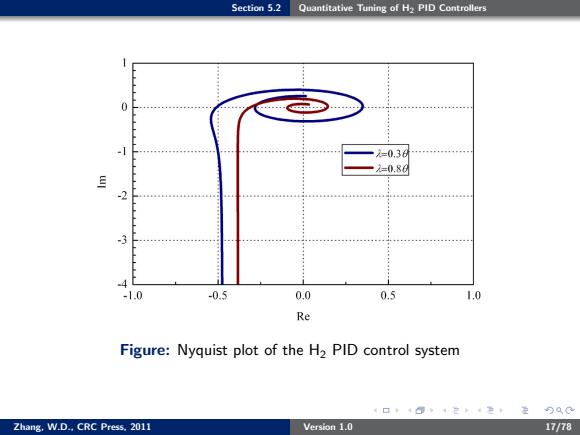
Section 5.2 Quantitative Tuning of H2 PID Controllers =0,3 -=0.8d 2 444444444444444 -3 .4 -1.0 -0.5 0.0 0.5 1.0 Re Figure:Nyquist plot of the H2 PID control system 4口,+@,4定4定90C Zhang.W.D..CRC Press.2011 Version 1.0 17/78
Section 5.2 Quantitative Tuning of H2 PID Controllers Figure: Nyquist plot of the H2 PID control system Zhang, W.D., CRC Press, 2011 Version 1.0 17/78