上浒充通大睾 Shanghai Jiao Tong University 目录 第一节微生物生长的测定 微生物生长概述 以数量变化对微生物生长情况进行测定 以生物量为指标测定微生物的生长 第二节细菌的群体生长繁殖 生长曲线 二、 同步培养(synchronous culture 三、连续培养 第三节微生物生长繁殖的控制(环境对生长的影响) 一、控制微生物的化学物质 二、控制微生物的物理因素 陈峰,上海交通大学生命学院微生物学
Shanghai Jiao Tong University 陈峰,上海交通大学生命学院微生物学 目录 第一节 微生物生长的测定 一、微生物生长概述 二、以数量变化对微生物生长情况进行测定 三、以生物量为指标测定微生物的生长 第二节 细菌的群体生长繁殖 一、生长曲线 二、同步培养(synchronous culture) 三、连续培养 第三节 微生物生长繁殖的控制(环境对生长的影响) 一、控制微生物的化学物质 二、控制微生物的物理因素
上序气通大学 Shanghai Jiao Tong University 第二节细菌的群体生长繁殖 微生物个体微小 除真菌外,我们肉眼看到或接触到的微生物是成千 上万个单个的微生物组成的群体。 对细菌群体生长规律的了解是对其进行研究 与利用的基础 陈峰,上海交通大学生命学院微生物学
Shanghai Jiao Tong University 陈峰,上海交通大学生命学院微生物学 第二节 细菌的群体生长繁殖 微生物个体微小 除真菌外,我们肉眼看到或接触到的微生物是成千 上万个单个的微生物组成的群体。 对细菌群体生长规律的了解是对其进行研究 与利用的基础
上气通大学 Shanghai Jiao Tong University 生长曲线 生长曲线(Growth Curve):细菌接种到定量的液体 培养基中,定时取样测定细胞数量,以培养时间为 横座标,以菌数为纵座标作图,得到的一条反映细 菌菌数变化规律的曲线。 Figure 6.12 Cell division. When the arithmetic number of Arithmetic Numbers Numbers Expressed as cells in each generation is of Cells a Power of 2 Visual Representation of Numbers expressed as a power of 2,the exponent tells the number of 1 20 doublings (generations)that have 2 occurred. 4 ●●●● 8 23 ●●●●●●●● If a single bacterium reproduced ●●●●●●●●●●●●●● every 20 minutes,how many 32 ●●●● ●● would there be in 2 hours? 1/宫 陈峰,上海交通大学生命学院微生物学
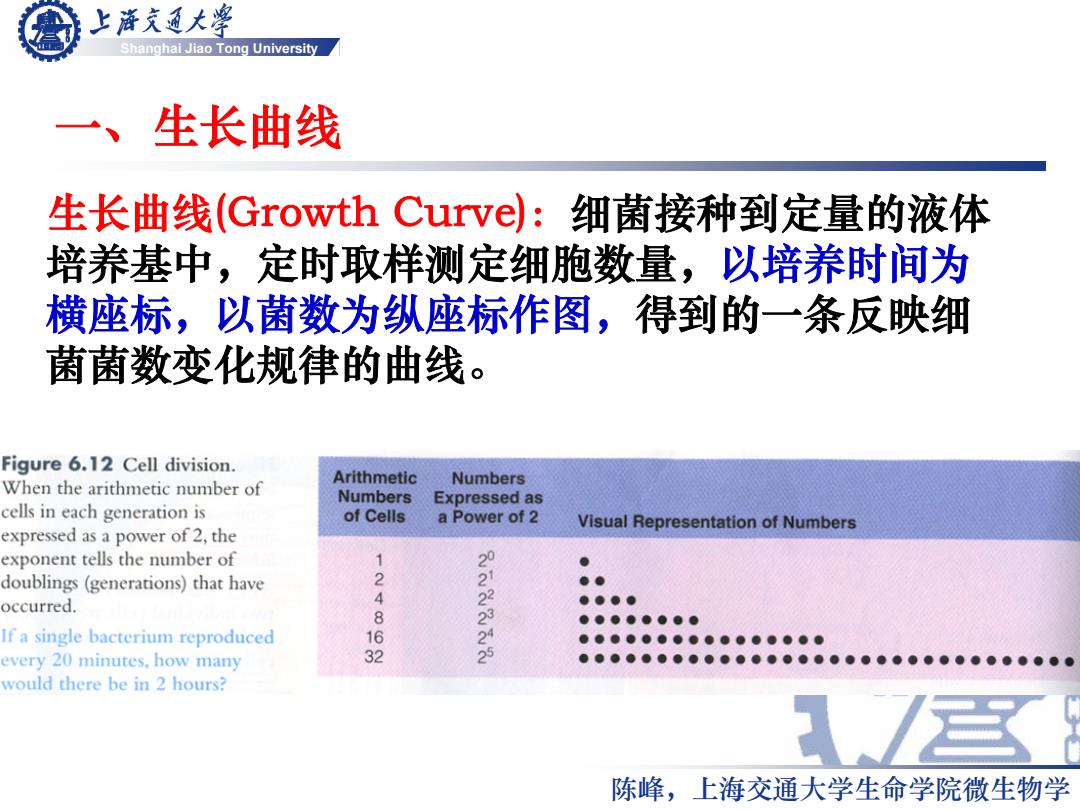
Shanghai Jiao Tong University 陈峰,上海交通大学生命学院微生物学 一、生长曲线 生长曲线(Growth Curve):细菌接种到定量的液体 培养基中,定时取样测定细胞数量,以培养时间为 横座标,以菌数为纵座标作图,得到的一条反映细 菌菌数变化规律的曲线
1,U4⊙,O1o) 6.0 (L0g10=6.02) 1.000.000 Logno of 5.0 Arithmetic Arithmetic SIlBo JO (0g10=4.50) Generation Number Number 4.0 Number of Cells of Cells sieqwnu (524.288) 0 1 0 (Log10=3.01) 3.0 500.000 5(25= 32 1.51 10(219= 1,024 3.01 (Log10=1.51) 15(215)= 32.768 4.52 2.0 (262,144) 16(216= 65,536 4.82 17(213= 131,072 5.12 1.0 (131.072) 18(218= 262,144 5.42 (65.536) 100,000 19(219= 524,288 5.72 (32) (1024) (32,768) 10.000 20(220= 1,048,576 6.02 5 10 15 20 Generations Figure 6.13 A growth curve for an exponentially increasing population,plotted logarithmically (dashed line) and arithmetically (solid line). If the arithmetic line were plotted for two more generations. would it still be on the page? 细菌的生长曲线一般用菌数的对数为纵坐标作图
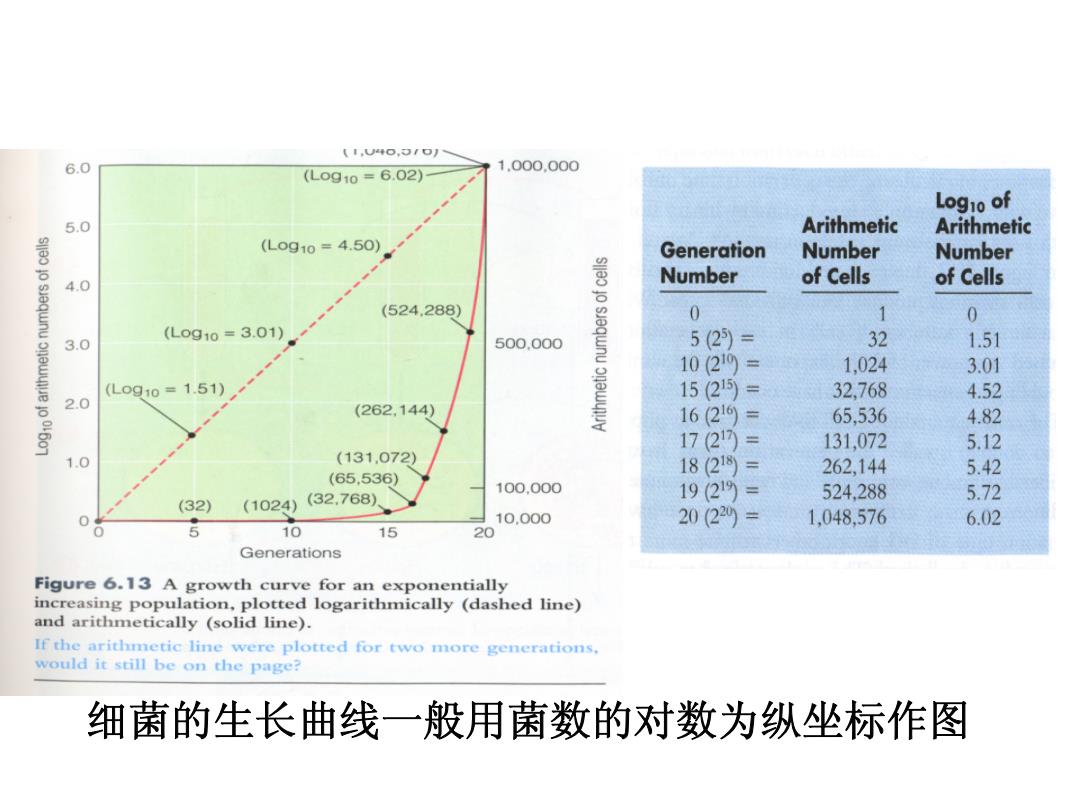
细菌的生长曲线一般用菌数的对数为纵坐标作图
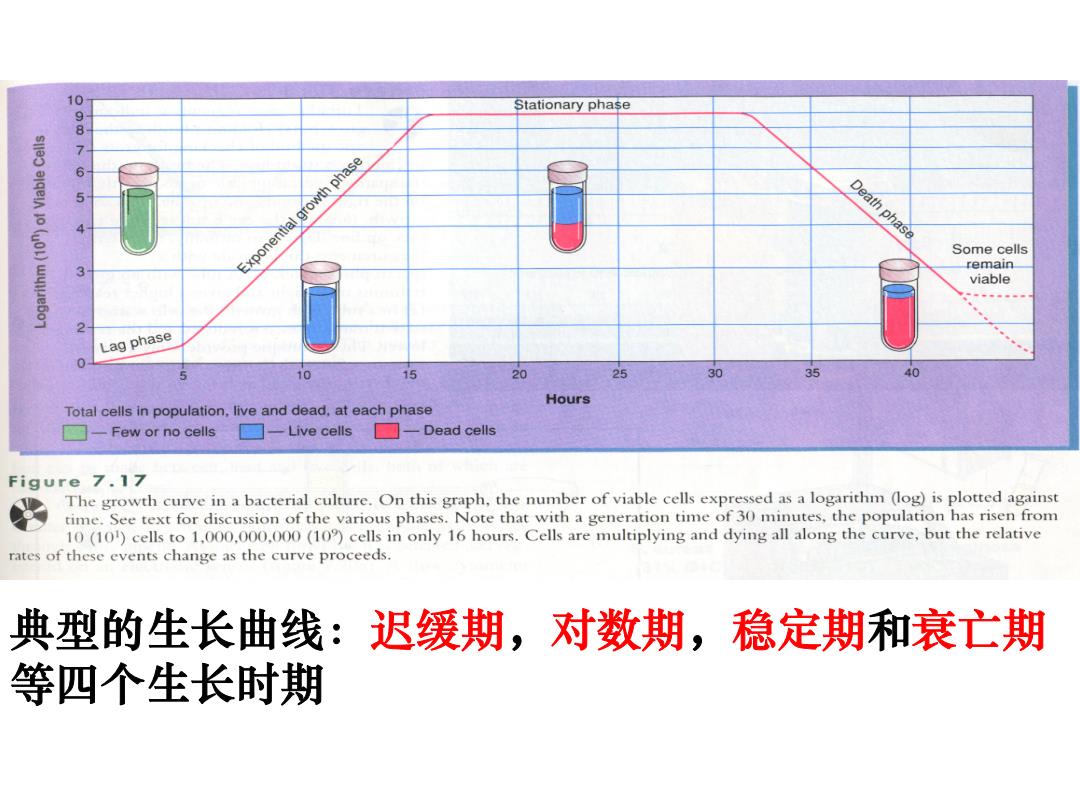
10 Stationary phase 987 6 Exponential growth phase Death phase Some cells remain viable Lag phase 5 10 15 20 25 30 35 40 Hours Total cells in population,live and dead,at each phase 一Few or no cells □Live cells ☐-Dead cells Figure 7.17 The growth curve in a bacterial culture.On this graph,the number of viable cells expressed as a logarithm (log)is plotted against time.See text for discussion of the various phases.Note that with a generation time of 30 minutes,the population has risen from 10(10)cells to 1.000.000.000(10)cells in only 16 hours.Cells are multiplying and dying all along the curve,but the relative rates of these events change as the curve proceeds. 典型的生长曲线:迟缓期,对数期,稳定期和衰亡期 等四个生长时期
典型的生长曲线:迟缓期,对数期,稳定期和衰亡期 等四个生长时期