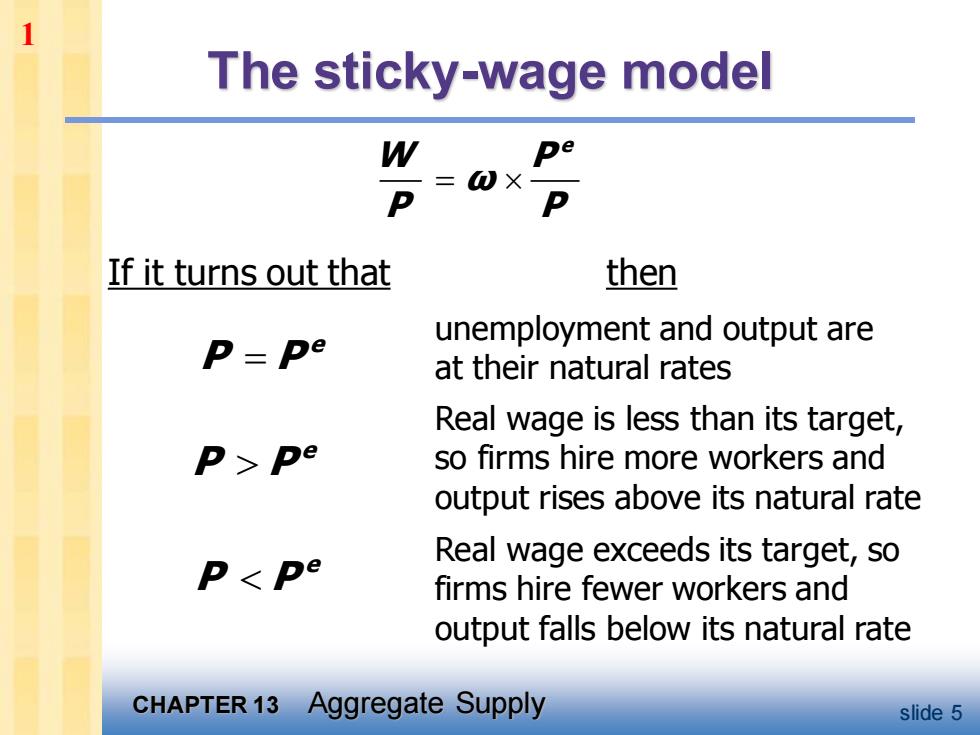
The sticky-wage model If it turns out that then unemployment and output are p=pe at their natural rates Real wage is less than its target, p pe so firms hire more workers and output rises above its natural rate Real wage exceeds its target,so p<pe firms hire fewer workers and output falls below its natural rate CHAPTER 13 Aggregate Supply slide 5
CHAPTER 13 Aggregate Supply slide 5 The sticky-wage model If it turns out that W P e ω P P = e P P= e P P e P P then unemployment and output are at their natural rates Real wage is less than its target, so firms hire more workers and output rises above its natural rate Real wage exceeds its target, so firms hire fewer workers and output falls below its natural rate 1
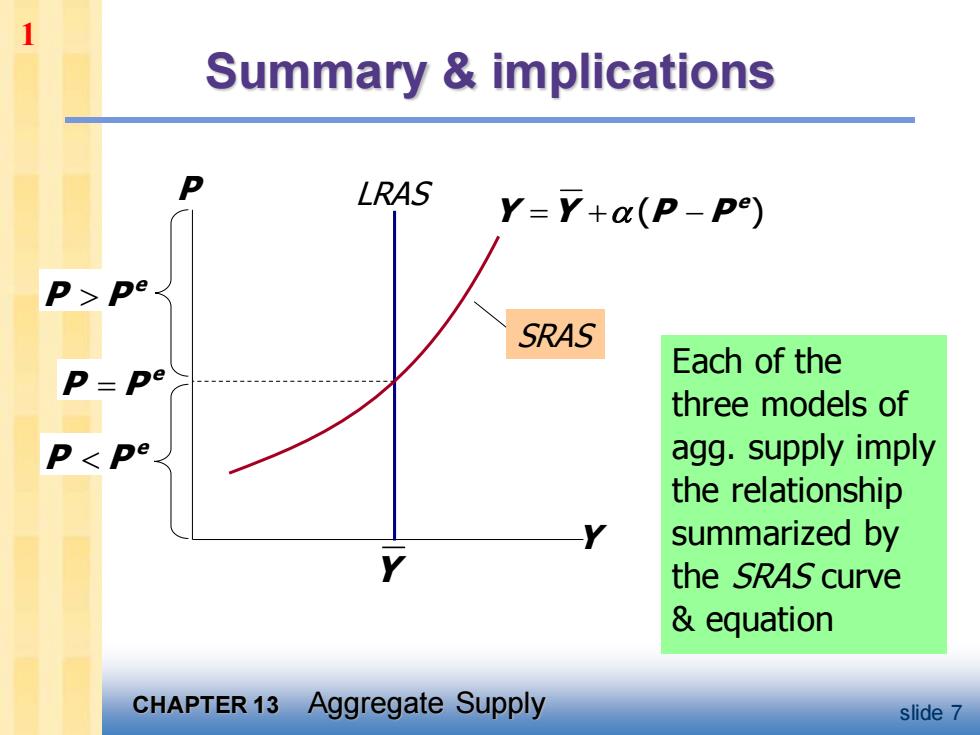
Summary implications LRAS Y=Y+a(P-P) SRAS Each of the three models of agg.supply imply the relationship summarized by the SRAS curve equation CHAPTER 13 Aggregate Supply slide 7
CHAPTER 13 Aggregate Supply slide 7 Summary & implications Each of the three models of agg. supply imply the relationship summarized by the SRAS curve & equation Y P LRAS Y SRAS ( )e Y Y P P = + − e P P= e P P e P P 1
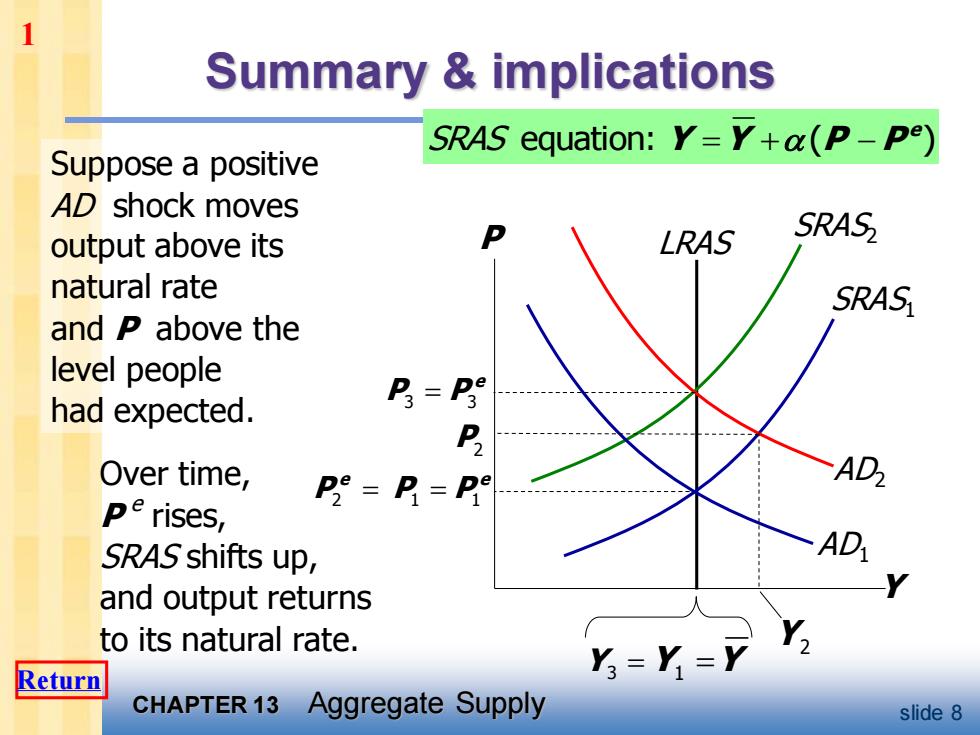
Summary implications SRAS equation:Y=Y+a(P-P) Suppose a positive AD shock moves output above its LRAS SRAS natural rate SRAS and P above the level people had expected. B= Over time, 只 Po=P= AD pe rises, SRAS shifts up, AD and output returns to its natural rate. Y, Return r=Y=Y CHAPTER 13 Aggregate Supply slide 8
CHAPTER 13 Aggregate Supply slide 8 Summary & implications Suppose a positive AD shock moves output above its natural rate and P above the level people had expected. Y P LRAS SRAS1 equation: ( )e SRAS Y Y P P = + − 1 1 e P P= SRAS2 AD1 AD2 2 e P = P2 3 3 e P P= Over time, P e rises, SRAS shifts up, and output returns to its natural rate. Y Y 1 = Y 2 Y3 = 1 Return
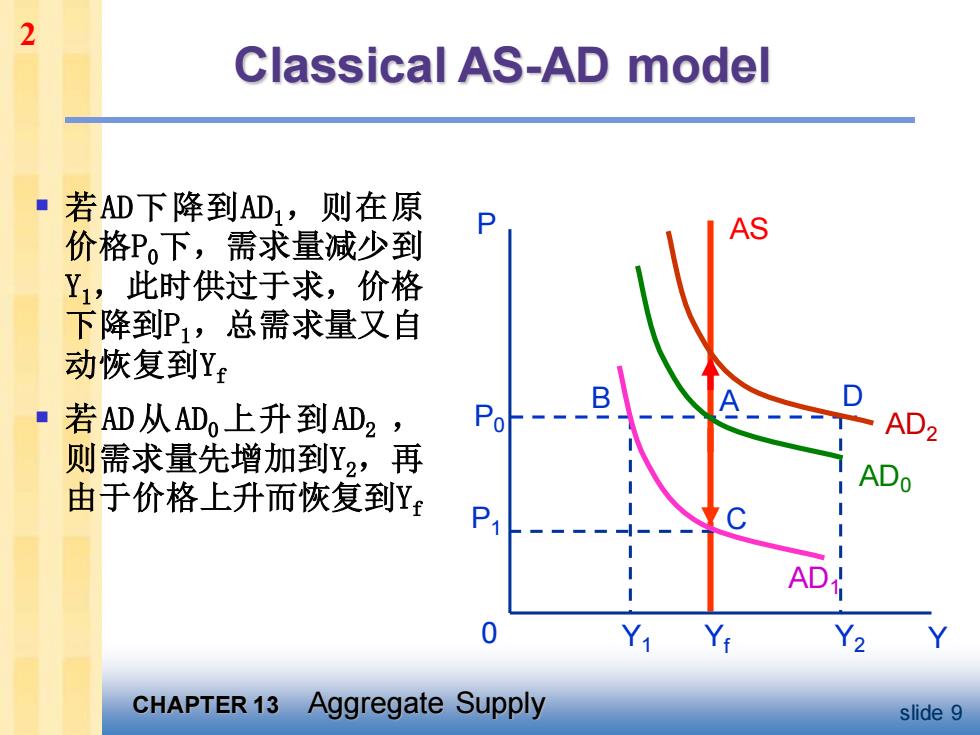
2 Classical AS-AD model 若AD下降到AD1,则在原 0 价格P。下,需求量减少到 AS Y1,此时供过于求,价格 下降到P,总需求量又自 动恢复到Y ·若AD从ADO上升到AD2 、B AD2 则需求量先增加到Y2,再 由于价格上升而恢复到Y ADo P1 AD 0 Y1 Yi Y2 CHAPTER 13 Aggregate Supply slide 9
CHAPTER 13 Aggregate Supply slide 9 Classical AS-AD model ▪ 若AD下降到AD1,则在原 价格P0下,需求量减少到 Y1,此时供过于求,价格 下降到P1,总需求量又自 动恢复到Yf ▪ 若AD从AD0上升到AD2 , 则需求量先增加到Y2,再 由于价格上升而恢复到Yf P P0 A AD0 P1 C AD1 0 Y1 Y AS B Yf AD2 D Y2 2
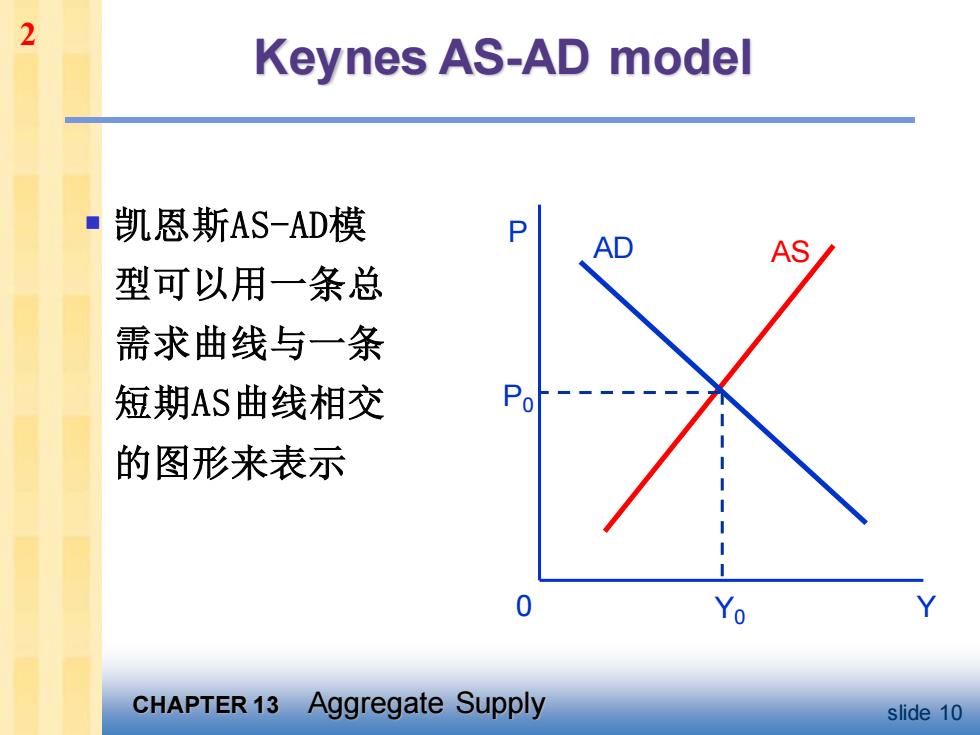
2 Keynes AS-AD model 凯恩斯AS-AD模 P AD AS 型可以用一条总 需求曲线与一条 短期AS曲线相交 Po 的图形来表示 0 Yo CHAPTER 13 Aggregate Supply slide 10
CHAPTER 13 Aggregate Supply slide 10 ▪ 凯恩斯AS-AD模 型可以用一条总 需求曲线与一条 短期AS曲线相交 的图形来表示 Keynes AS-AD model P 0 Y0 Y AD AS P0 2