Chapter 6 Production Chapter Outline >The Technology of Production >[soquants(等产量线) >Production with one Variable Input >Production with Two Variable Inputs >Returns to Scale(规模报酬)
Chapter 6 Production Chapter Outline ➢ The Technology of Production ➢ Isoquants (等产量线) ➢ Production with one Variable Input ➢ Production with Two Variable Inputs ➢ Returns to Scale (规模报酬)
6.1 The Technology of Production Theory of the firm-Explanation of how a firm makes cost-minimizing production decisions and how its cost varies with its output. Factors of production-Inputs into the production process (e.g.,labor,capital,and materials). A production function describes the maximum output a firm can produce for each specified combination of inputs. Q=FK,L)
6.1 The Technology of Production ❑ Theory of the firm-Explanation of how a firm makes cost-minimizing production decisions and how its cost varies with its output. ❑ Factors of production-Inputs into the production process (e.g., labor, capital, and materials). ❑ A production function describes the maximum output a firm can produce for each specified combination of inputs. Q = F(K, L)
6.2Is0 quant(等产量线) An isoquant is a curve that shows all combinations of inputs that yield a given level of output. ▣Isoquant map-Graph(曲线图)combining several isoquants, used to describe a production function. A firm's production function can be represented by a series of isoquants associated with different levels of output
❑ An isoquant is a curve that shows all combinations of inputs that yield a given level of output. ❑ Isoquant map—Graph(曲线图)combining several isoquants, used to describe a production function. A firm’s production function can be represented (描述)by a series of isoquants associated with different levels of output. 6.2 Isoquant (等产量线)
Production with Two Variable Inputs Captial per Year 5 3 DCC0 ■■■■■■■■■■ A B: 2。 Q3=90 ■■■■■■■■ Q2=75 Q1=55 3 (Labor per Year)
Production with Two Variable Inputs A B C Q1 = 55 Q2 = 75 Q3 = 90 (Labor per Year) Captial per Year 1 2 3 1 3 5 D E 2 F

Production isoquants show the various combinations of inputs necessary for the firm to produce a given output. A set of isoquants,or isoquant map,describes the firm's production function. Output increases as we move from isoquant Q(at which 55 units per year are produced at points such as A and D),to isoquant Q2 (75 units per year at points such as B and F)and to isoquant Q3 (90 units per year at points such as C and E)
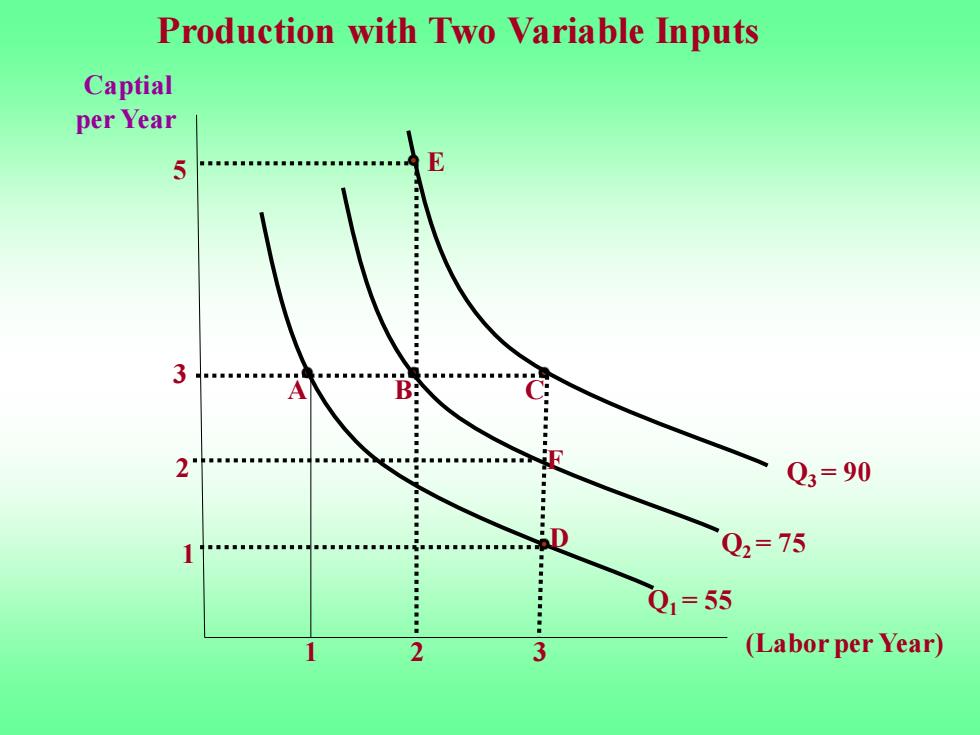
Production isoquants show the various combinations of inputs necessary for the firm to produce a given output. A set of isoquants, or isoquant map, describes the firm’s production function. Output increases as we move from isoquant Q1 (at which 55 units per year are produced at points such as A and D), to isoquant Q2 (75 units per year at pointssuch as B and F) and to isoquant Q3 (90 units per year at pointssuch as C and E)