
Chapter 2 The Basics of Supply and Demand Supply and Demand >The Market Mechanism >Changes in Market Equilibrium >Elasticities of Supply and Demand >Short-Run versus Long-Run Elasticities >Effects of Government Intervention-Price Controls
Chapter 2 The Basics of Supply and Demand ➢ Supply and Demand ➢ The Market Mechanism ➢ Changes in Market Equilibrium ➢ Elasticities of Supply and Demand ➢ Short-Run versus Long-Run Elasticities ➢ Effects of Government Intervention-Price Controls
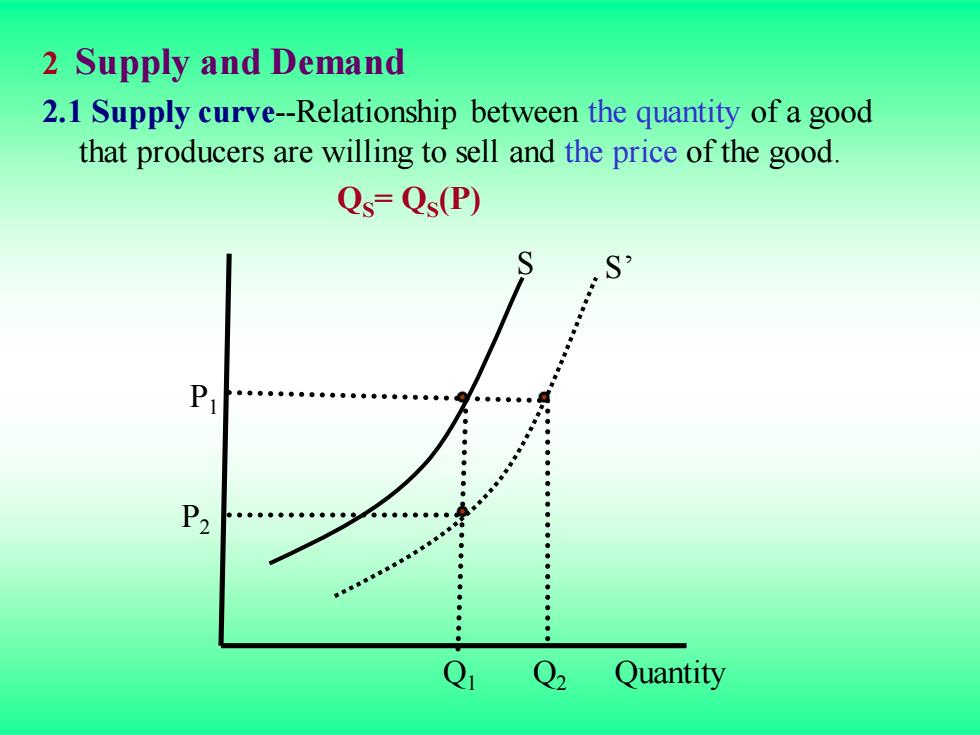
2 Supply and Demand 2.1 Supply curve-Relationship between the quantity of a good that producers are willing to sell and the price of the good. Qs=Qs(P) P2 ●● Q Q2 Quantity
2 Supply and Demand 2.1 Supply curve-Relationship between the quantity of a good that producers are willing to sell and the price of the good. QS= QS (P) Q Quantity Q1 2 P2 P1 S S’

The supply curve show how the quantity of a good offered for sale changes as the price of the good changes. The supply curve is upward sloping;the higher the price,the more firms are able and willing to produce and sell. If production costs fall,firms can produce the same quantity at a lower price or a larger quantity at the same price.The supply curve then shifts to the right
The supply curve show how the quantity of a good offered for sale changes as the price of the good changes. The supply curve is upward sloping; the higher the price, the more firms are able and willing to produce and sell. If production costs fall, firms can produce the same quantity at a lower price or a larger quantity at the same price. The supply curve then shifts to the right

2.2 Demand Curve Demand curve-Relationship between the quantity of a good that consumers are willing to buy and the price of the good. Qp-Qp(P) Price : P2 P Quantity
2.2 Demand Curve Demand curve-Relationship between the quantity of a good that consumers are willing to buy and the price of the good. QD =QD(P) Q2 Quantity Q1 P1 P2 Price D D’

The demand curve show how the quantity of a good demanded by consumers depends on its price. The demand curve is downward sloping;holding other things equal,consumers will want to purchase more of a good the lower is its price. The quantity demanded may also depend on other variables,such as income,the weather,and the prices of other goods. For most products,the quantity demanded increases when income rises.A higher income level shifts the demand curve to the right
The demand curve show how the quantity of a good demanded by consumers depends on its price. The demand curve is downward sloping; holding other things equal, consumers will want to purchase more of a good the lower is its price. The quantity demanded may also depend on other variables, such as income, the weather, and the prices of other goods. For most products, the quantity demanded increases when income rises. A higher income level shifts the demand curve to the right