
CHAPTER TWELVE Aggregate Demand in the Open Economy macroeconomics N.Gregory Mankiw College of Management,HUST
macroeconomics N. Gregory Mankiw m a c r o College of Management, HUST CHAPTER TWELVE Aggregate Demand in the Open Economy
Learning objectives ■ The Mundell-Fleming model: IS-LM for the small open economy Causes and effects of interest rate differentials Arguments for fixed vs.floating exchange rates The aggregate demand curve for the small open economy CHAPTER 12 Aggregate Demand in the Open Economy slide 1
slide 1 § The Mundell-Fleming model: IS-LM for the small open economy § Causes and effects of interest rate differentials § Arguments for fixed vs. floating exchange rates § The aggregate demand curve for the small open economy
Content 1.The Mundell-Fleming model 2.Policy analysis under floating exchange rates 3.Policy analysis under fixed exchange rates 4.Interest rate differentials 5.Mundell-Fleming model as an AD theory 6.Case study 7.Chapter summary CHAPTER 12 Aggregate Demand in the Open Economy slide 2
slide 2 1. The Mundell-Fleming model 2. Policy analysis under floating exchange rates 3. Policy analysis under fixed exchange rates 4. Interest rate differentials 5. Mundell-Fleming model as an AD theory 6. Case study 7. Chapter summary
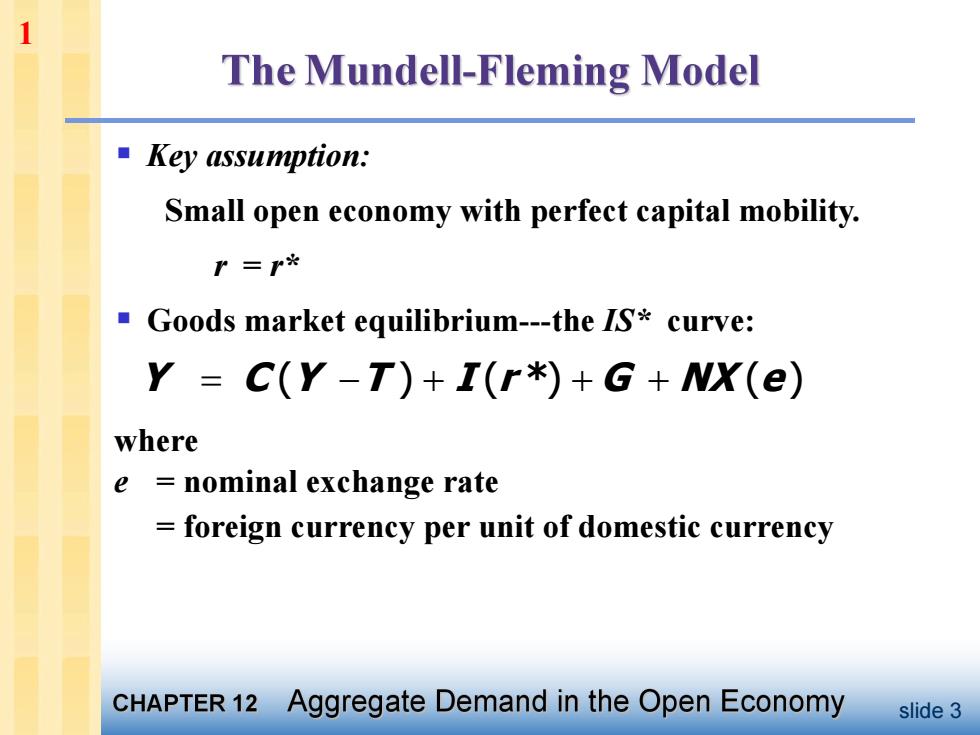
1 The Mundell-Fleming Model ■Key assumption: Small open economy with perfect capital mobility. P=r必 ■( Goods market equilibrium-the IS*curve: Y =C(Y-T)+I(r*)+G+NX(e) where e nominal exchange rate foreign currency per unit of domestic currency CHAPTER 12 Aggregate Demand in the Open Economy slide 3
slide 3 § Key assumption: Small open economy with perfect capital mobility. r = r* § Goods market equilibrium-the IS* curve: Y C (Y T ) I (r *) G NX (e) where e = nominal exchange rate = foreign currency per unit of domestic currency 1
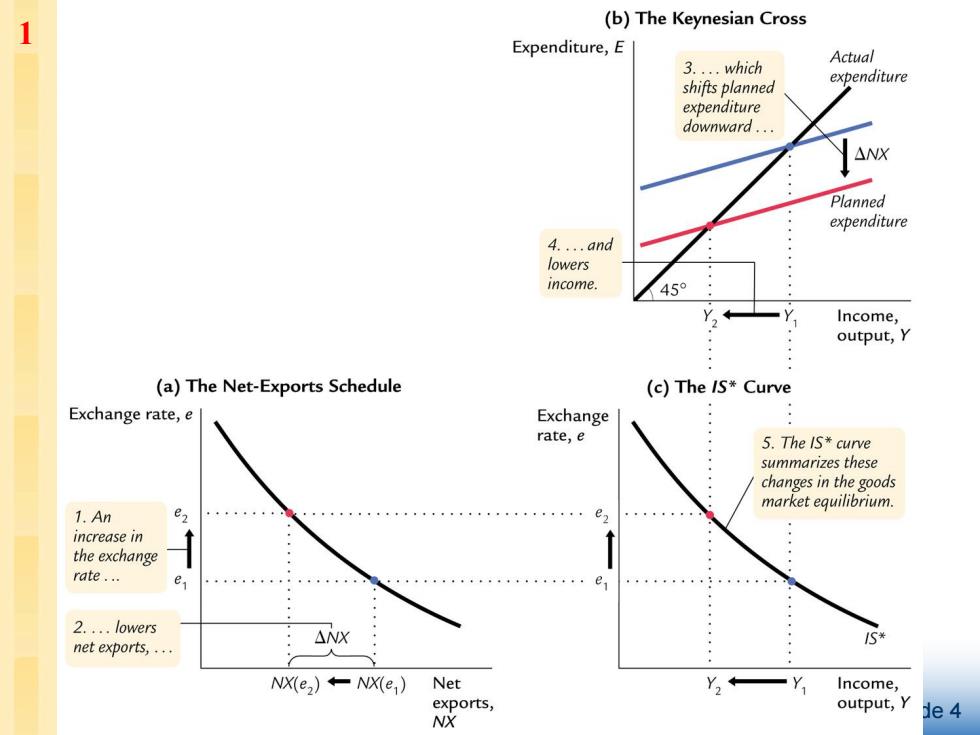
1 (b)The Keynesian Cross Expenditure,E 3.which Actual expenditure shifts planned expenditure downward. △NX Planned expenditure 4.and lowers income. 45° Income, output,Y (a)The Net-Exports Schedule (c)The /S*Curve Exchange rate,e Exchange rate,e 5.The IS*curve summarizes these changes in the goods market equilibrium. 1.An e2 increase in the exchange rate. e e 2.lowers net exports,. : △NX 5* NX(e2)+-NX(e;) Net Y+ 一Y Income, exports, output,y 1e4 NX
slide 4 1