Modifying Program Behavior Pin allows you not only to observe but also change program behavior Ways to change program behavior: Add/delete instructions Change register values > Change control flow Change memory values 6
Modifying Program Behavior Pin allows you not only to observe but also change program behavior • Ways to change program behavior: ➢ Add/delete instructions ➢ Change register values ➢ Change control flow ➢ Change memory values 6
Pin Invocation Launcher Process ● ● pin.exe -t inscountung26830pt.txt 8 PIN.EXE ● ● ● cation instructions executed, ● ● 上ncprints Gountatcend ● Launcher the eude ● et ● ● icode the into.the Coue Cache ●●●●●●●● kecute Jltfed code Boot Routine inscount.dll Application Process Data: ● First firstApplp, PIN.LIB “nscount.dlI app ● PINVM.DLL Decoder Encoder Code Cache ● Application ● Code and Data ● ● ● System Call Event Thread Dispatcher Dispatcher Dispatcher NTDLL.DLL app lp of 。●.Trace's。● target Windows kernel
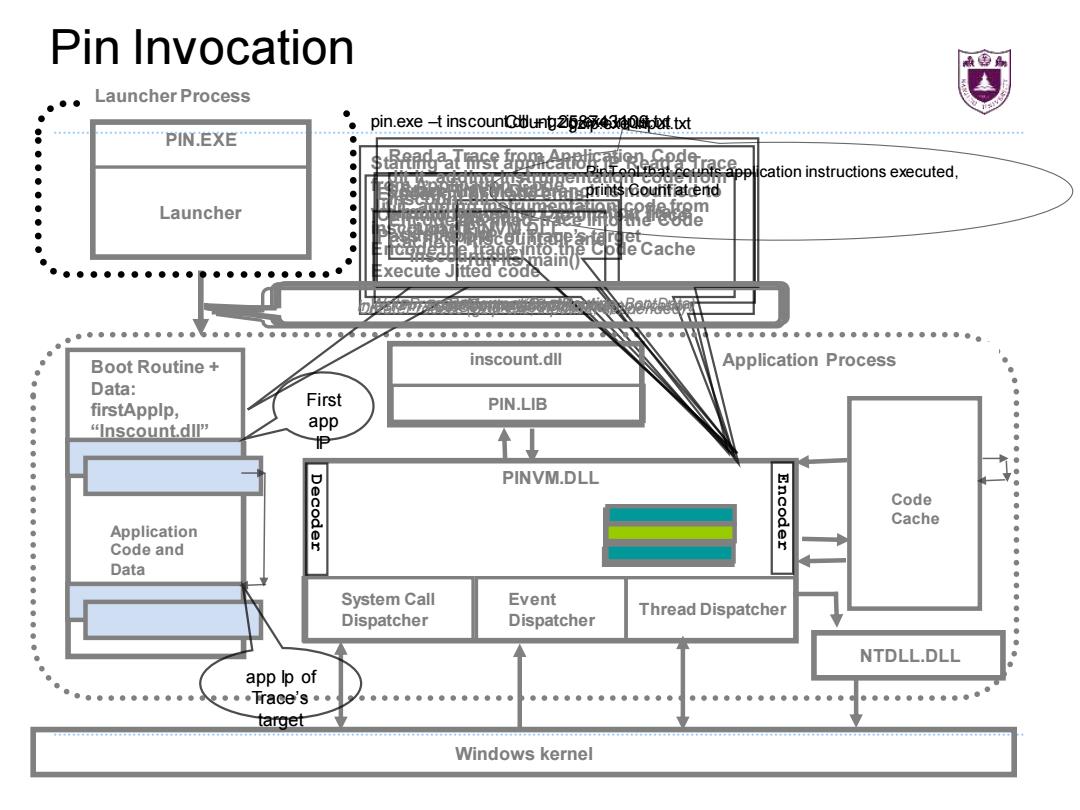
Starting at first application IP Read a Trace from Application Code Jit it, adding instrumentation code from inscount.dll Encode the trace into the Code Cache Execute Jitted code Execution of Trace ends Call into PINVM.DLL to Jit next trace Pass in app IP of Trace’s target Source Trace exit branch is modified to directly branch to Destination Trace Pin Invocation gzip.exe input.txt Application Code and Data Application Process System Call Dispatcher Event Dispatcher Thread Dispatcher PINVM.DLL inscount.dll PIN.LIB Code Cache NTDLL.DLL Windows kernel CreateProcess (gzip.exe, input.txt, suspended) Launcher PIN.EXE Launcher Process Boot Routine + Data: firstAppIp, “Inscount.dll” Load PINVM.DLL Inject Pin BootRoutine and Data into application Load inscount.dll and run its main() Start PINVM.DLL running (firstAppIp, “inscount.dll”) pin.exe –t inscount.dll Count 258743109 – gzip.exe input.txt PinTool that counts application instructions executed, prints Count at end Resume at BootRoutine First app IP app Ip of Trace’s target Read a Trace from Application Code Jit it, adding instrumentation code from inscount.dll Encode the jitted trace into the Code Cache WriteProcessMemory(BootRoutine, BootData) SetContext(BootRoutineIp) GetContext(&firstAppIp) Decoder Encoder
Instrumentation Granularity Instruction instrumentation ·Basic block A sequence of instructions terminated at a control-flow changing instruction Single entry,single exit Trace instrumentation A sequence of basic blocks terminated at an unconditional control-flow changing instruction Single entry,multiple exits Routine instrumentation Image instrumentation 8
Instrumentation Granularity • Instruction instrumentation • Basic block ➢ A sequence of instructions terminated at a control-flow changing instruction ➢ Single entry, single exit • Trace instrumentation ➢ A sequence of basic blocks terminated at an unconditional control-flow changing instruction ➢ Single entry, multiple exits • Routine instrumentation • Image instrumentation 8
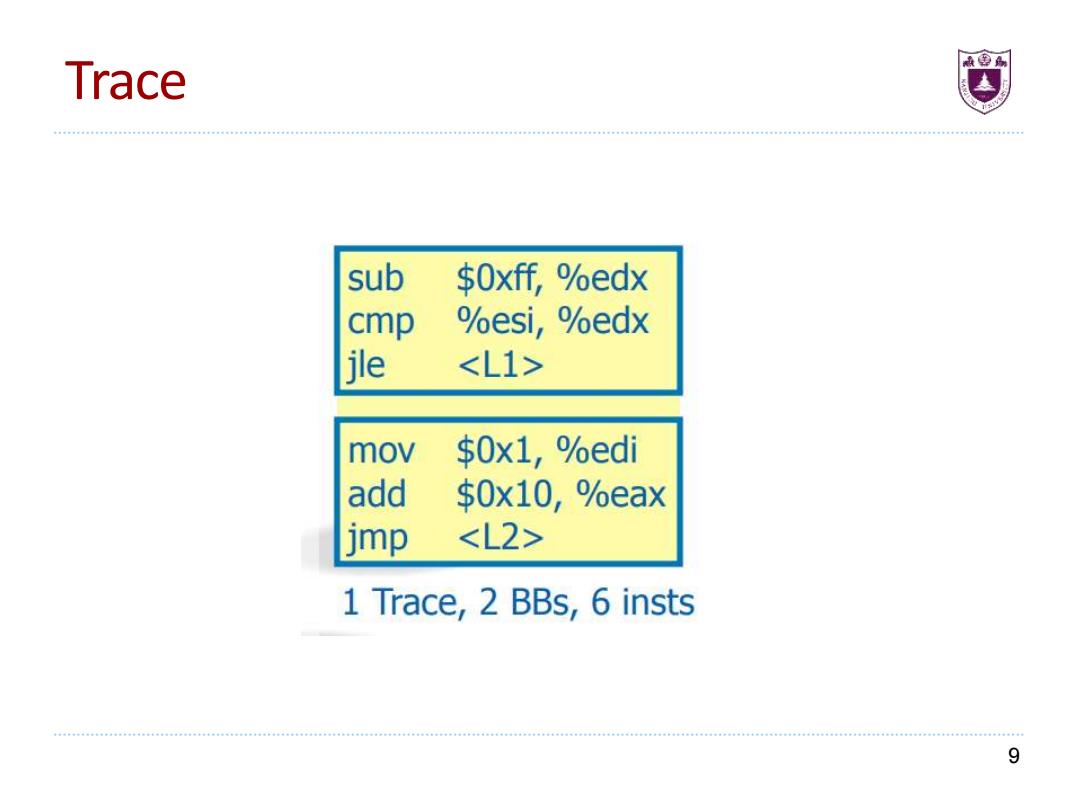
Trace sub $Oxff,%edx cmp %esi,%edx jle <L1> mov $0x1,%edi add $0x10,%eax jmp <L2> 1 Trace,2 BBs,6 insts 9
Trace 9
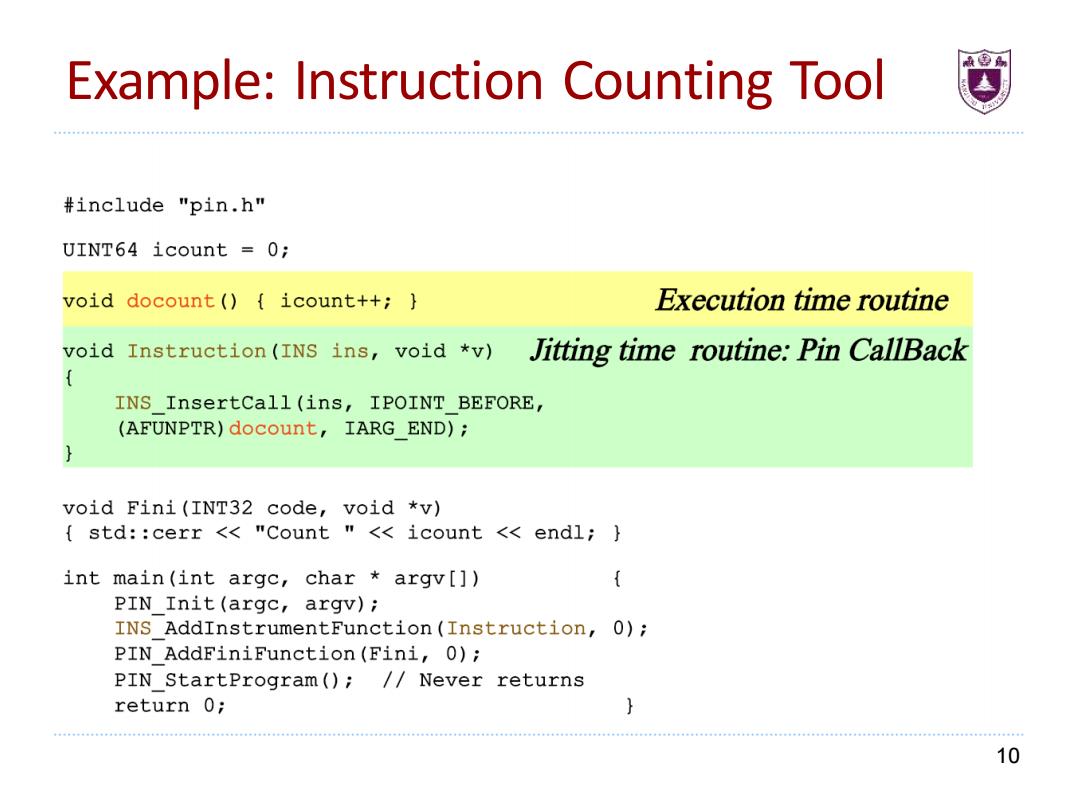
Example:Instruction Counting Tool #include "pin.h" UINT64 icount 0; void docount ()icount++; Execution time routine void Instruction(INS ins,void *v) Jitting time routine:Pin CallBack INS InsertCall(ins,IPOINT BEFORE, (AFUNPTR)docount,IARG END); void Fini(INT32 code,void *v) std::cerr <"Count "<icount <endl; int main(int argc,char argv[]) PIN Init (argc,argv); INS AddInstrumentFunction(Instruction,0); PIN AddFiniFunction(Fini,0); PIN StartProgram();//Never returns return 0; 10
Example: Instruction Counting Tool 10