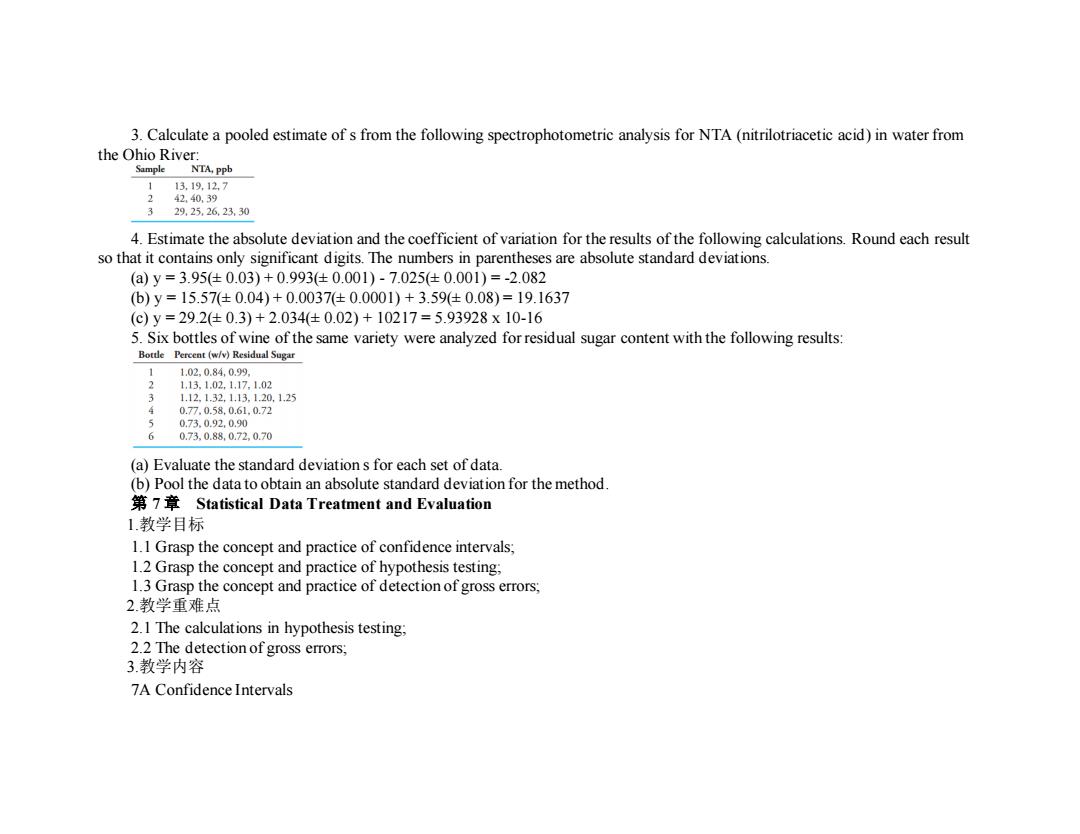
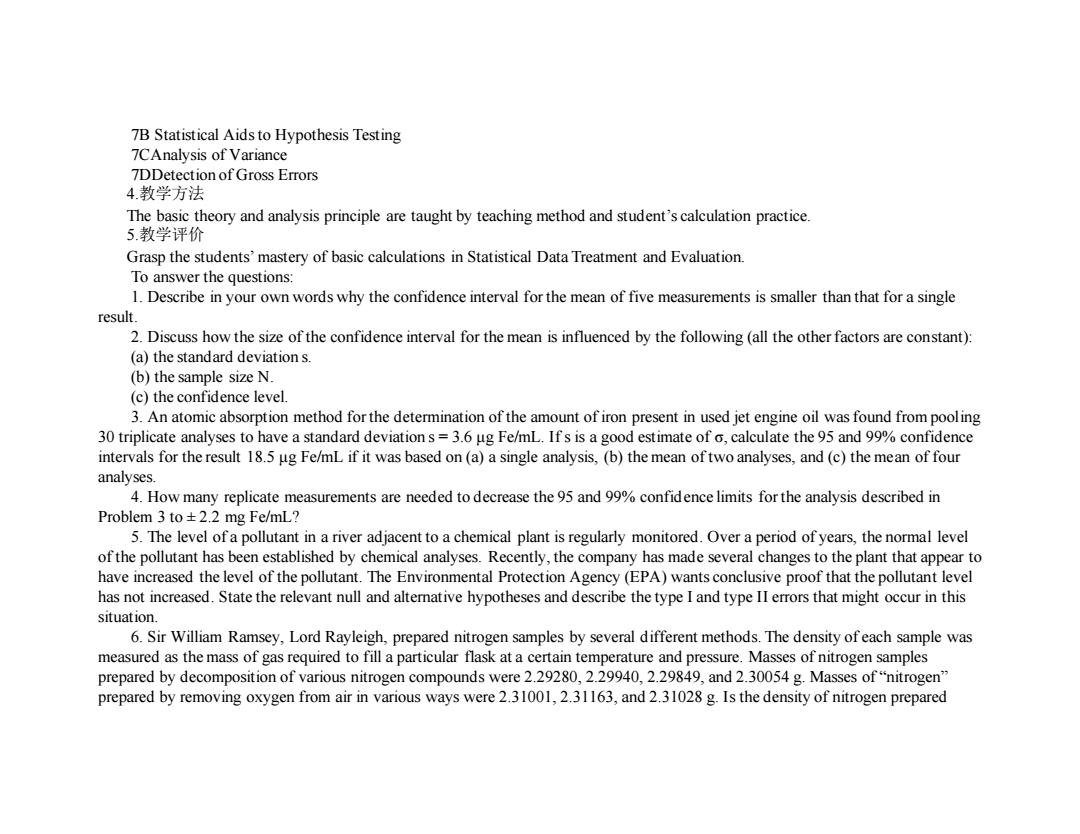
3.Calculate a pooled estimate of s from the following spectrophotometric analysis for NTA(nitrilotriacetic acid)in water from the Ohio River: Sample NTA,ppb 113.19.12.7 2 42.40,39 329.25.26.23.30 4.Estimate the absolute deviation and the coefficient of variation for the results of the following calculations.Round each result so that it contains only significant digits.The numbers in parentheses are absolute standard deviations. (a)y=3.95(±0.03)+0.993(±0.001)-7.025±0.001)=-2.082 (b)y=15.57(±0.04)+0.0037(±0.0001)+3.59(±0.08)=19.1637 (C)y=29.2±0.3)+2.034±0.02)+10217=5.93928x10⁻¹⁶ 5.Six bottles of wine of the same variety were analyzed for residual sugar content with the following results: Bottle Percent(w/v)Residual Sugar 1 1.02,0.84,0.99. 2 1.13.1.02.1.17.1.02 3 1.12.1.32,1.13,1.20.1.25 4 0.77.0.58.0.61.0.72 0.73.0.92.0.90 6 0.73.0.88.0.72,0.70 (a)Evaluate the standard deviation s for each set of data. (b)Pool the data to obtain an absolute standard deviation for the method. 7 Statistical Data Treatment and Evaluation 1.教学目标 1.1 Grasp the concept and practice of confidence intervals; 1.2 Grasp the concept and practice of hypothesis testing; 1.3 Grasp the concept and practice of detection of gross errors; 2.教学重难点 2.1 The calculations in hypothesis testing; 2.2 The detection of gross errors; 3.教学内容 7A Confidence Intervals
3. Calculate a pooled estimate of s from the following spectrophotometric analysis for NTA (nitrilotriacetic acid) in water from the Ohio River: 4. Estimate the absolute deviation and the coefficient of variation for the results of the following calculations. Round each result so that it contains only significant digits. The numbers in parentheses are absolute standard deviations. (a) y = 3.95(± 0.03) + 0.993(± 0.001) - 7.025(± 0.001) = -2.082 (b) y = 15.57(± 0.04) + 0.0037(± 0.0001) + 3.59(± 0.08) = 19.1637 (c) y = 29.2(± 0.3) + 2.034(± 0.02) + 10217 = 5.93928 x 10⁻¹⁶ 5. Six bottles of wine of the same variety were analyzed for residual sugar content with the following results: (a) Evaluate the standard deviation s for each set of data. (b) Pool the data to obtain an absolute standard deviation for the method. 第 7 章 Statistical Data Treatment and Evaluation 1.教学目标 1.1 Grasp the concept and practice of confidence intervals; 1.2 Grasp the concept and practice of hypothesis testing; 1.3 Grasp the concept and practice of detection of gross errors; 2.教学重难点 2.1 The calculations in hypothesis testing; 2.2 The detection of gross errors; 3.教学内容 7A Confidence Intervals
7B Statistical Aids to Hypothesis Testing 7CAnalysis of Variance 7DDetection of Gross Errors 4教学方法 The basic theory and analysis principle are taught by teaching method and student's calculation practice. 5.教学评价 Grasp the students'mastery of basic calculations in Statistical Data Treatment and Evaluation. To answer the questions: 1.Describe in your own words why the confidence interval for the mean of five measurements is smaller than that for a single result. 2.Discuss how the size of the confidence interval for the mean is influenced by the following(all the other factors are constant): (a)the standard deviation s. (b)the sample size N. (c)the confidence level. 3.An atomic absorption method for the determination of the amount of iron present in used jet engine oil was found from pooling 30 triplicate analyses to have a standard deviation s=3.6 ug Fe/mL.Ifs is a good estimate of o,calculate the 95 and 99%confidence intervals for the result 18.5 ug Fe/mL if it was based on(a)a single analysis,(b)the mean of two analyses,and(c)the mean of four analyses. 4.How many replicate measurements are needed to decrease the 95 and 99%confidence limits for the analysis described in Problem 3 to +2.2 mg Fe/mL? 5.The level of a pollutant in a river adjacent to a chemical plant is regularly monitored.Over a period of years,the normal level of the pollutant has been established by chemical analyses.Recently,the company has made several changes to the plant that appear to have increased the level of the pollutant.The Environmental Protection Agency(EPA)wants conclusive proof that the pollutant level has not increased.State the relevant null and altemnative hypotheses and describe the type I and type II errors that might occur in this situation. 6.Sir William Ramsey,Lord Rayleigh,prepared nitrogen samples by several different methods.The density ofeach sample was measured as the mass of gas required to fill a particular flask at a certain temperature and pressure.Masses of nitrogen samples prepared by decomposition of various nitrogen compounds were 2.29280,2.29940,2.29849,and 2.30054 g.Masses of"nitrogen" prepared by removing oxygen from air in various ways were 2.31001,2.31163,and 2.31028 g.Is the density of nitrogen prepared
7B Statistical Aids to Hypothesis Testing 7CAnalysis of Variance 7DDetection of Gross Errors 4.教学方法 The basic theory and analysis principle are taught by teaching method and student’s calculation practice. 5.教学评价 Grasp the students’ mastery of basic calculations in Statistical Data Treatment and Evaluation. To answer the questions: 1. Describe in your own words why the confidence interval for the mean of five measurements is smaller than that for a single result. 2. Discuss how the size of the confidence interval for the mean is influenced by the following (all the other factors are constant): (a) the standard deviation s. (b) the sample size N. (c) the confidence level. 3. An atomic absorption method for the determination of the amount of iron present in used jet engine oil was found from pooling 30 triplicate analyses to have a standard deviation s = 3.6 μg Fe/mL. If s is a good estimate of σ, calculate the 95 and 99% confidence intervals for the result 18.5 μg Fe/mL if it was based on (a) a single analysis, (b) the mean of two analyses, and (c) the mean of four analyses. 4. How many replicate measurements are needed to decrease the 95 and 99% confidence limits for the analysis described in Problem 3 to ± 2.2 mg Fe/mL? 5. The level of a pollutant in a river adjacent to a chemical plant is regularly monitored. Over a period of years, the normal level of the pollutant has been established by chemical analyses. Recently, the company has made several changes to the plant that appear to have increased the level of the pollutant. The Environmental Protection Agency (EPA) wants conclusive proof that the pollutant level has not increased. State the relevant null and alternative hypotheses and describe the type I and type II errors that might occur in this situation. 6. Sir William Ramsey, Lord Rayleigh, prepared nitrogen samples by several different methods. The density of each sample was measured as the mass of gas required to fill a particular flask at a certain temperature and pressure. Masses of nitrogen samples prepared by decomposition of various nitrogen compounds were 2.29280, 2.29940, 2.29849, and 2.30054 g. Masses of “nitrogen” prepared by removing oxygen from air in various ways were 2.31001, 2.31163, and 2.31028 g. Is the density of nitrogen prepared
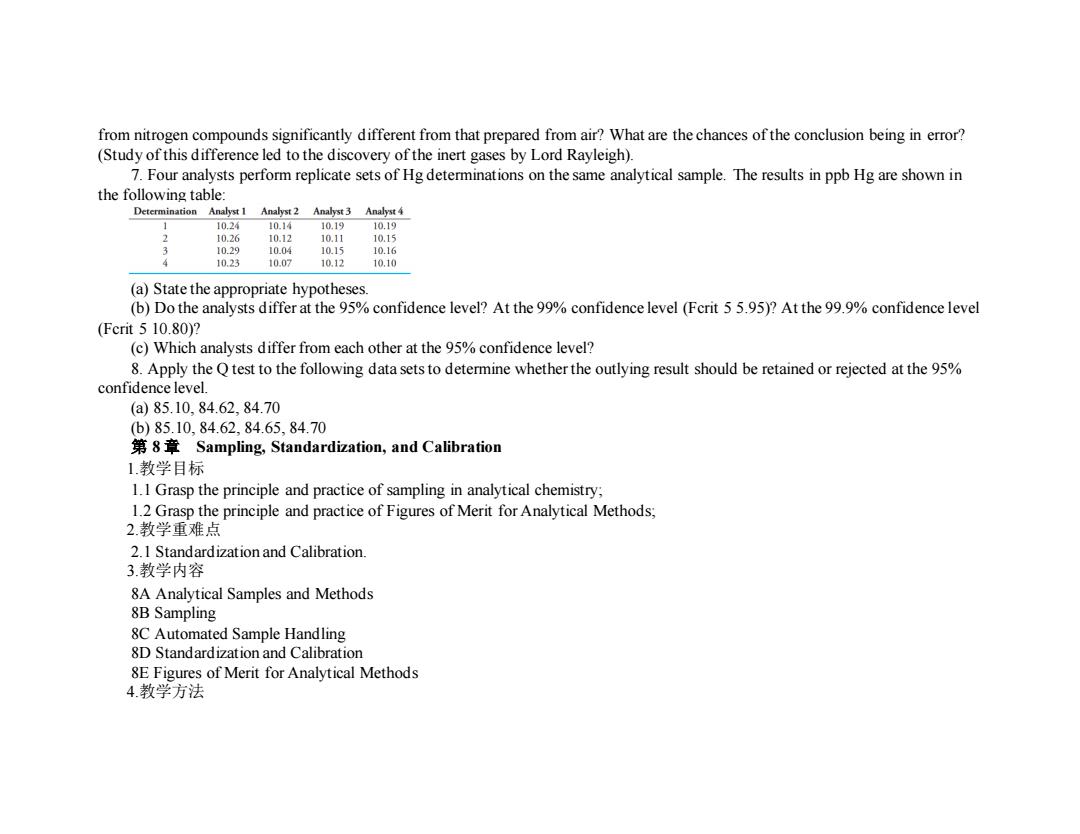
from nitrogen compounds significantly different from that prepared from air?What are the chances of the conclusion being in error? (Study of this difference led to the discovery of the inert gases by Lord Rayleigh). 7.Four analysts perform replicate sets of Hg determinations on the same analytical sample.The results in ppb Hg are shown in the following table: Determination Analyst 1 Analyst 2 Analyst 3 Analyst 4 10.24 10.14 10.19 10.19 2 10.26 10.12 10.11 10.15 3 10.29 10.04 10.15 10.16 10.23 10.07 10.12 10.10 (a)State the appropriate hypotheses. (b)Do the analysts differ at the 95%confidence level?At the 99%confidence level (Fcrit 5 5.95)?At the 99.9%confidence level (Fcrit510.80)2 (c)Which analysts differ from each other at the 95%confidence level? 8.Apply the Q test to the following data sets to determine whether the outlying result should be retained or rejected at the 95% confidence level. (a)85.10,84.62,84.70 b)85.10.84.62.84.65.84.70 8 Sampling,Standardization,and Calibration 1.教学目标 1.1 Grasp the principle and practice of sampling in analytical chemistry; 1.2 Grasp the principle and practice of Figures of Merit for Analytical Methods; 2.教学重难点 2.1 Standardization and Calibration 3.教学内容 8A Analytical Samples and Methods 8B Sampling 8C Automated Sample Handling 8D Standardization and Calibration 8E Figures of Merit for Analytical Methods 4.教学方法
from nitrogen compounds significantly different from that prepared from air? What are the chances of the conclusion being in error? (Study of this difference led to the discovery of the inert gases by Lord Rayleigh). 7. Four analysts perform replicate sets of Hg determinations on the same analytical sample. The results in ppb Hg are shown in the following table: (a) State the appropriate hypotheses. (b) Do the analysts differ at the 95% confidence level? At the 99% confidence level (Fcrit 5 5.95)? At the 99.9% confidence level (Fcrit 5 10.80)? (c) Which analysts differ from each other at the 95% confidence level? 8. Apply the Q test to the following data sets to determine whether the outlying result should be retained or rejected at the 95% confidence level. (a) 85.10, 84.62, 84.70 (b) 85.10, 84.62, 84.65, 84.70 第 8 章 Sampling, Standardization, and Calibration 1.教学目标 1.1 Grasp the principle and practice of sampling in analytical chemistry; 1.2 Grasp the principle and practice of Figures of Merit for Analytical Methods; 2.教学重难点 2.1 Standardization and Calibration. 3.教学内容 8A Analytical Samples and Methods 8B Sampling 8C Automated Sample Handling 8D Standardization and Calibration 8E Figures of Merit for Analytical Methods 4.教学方法
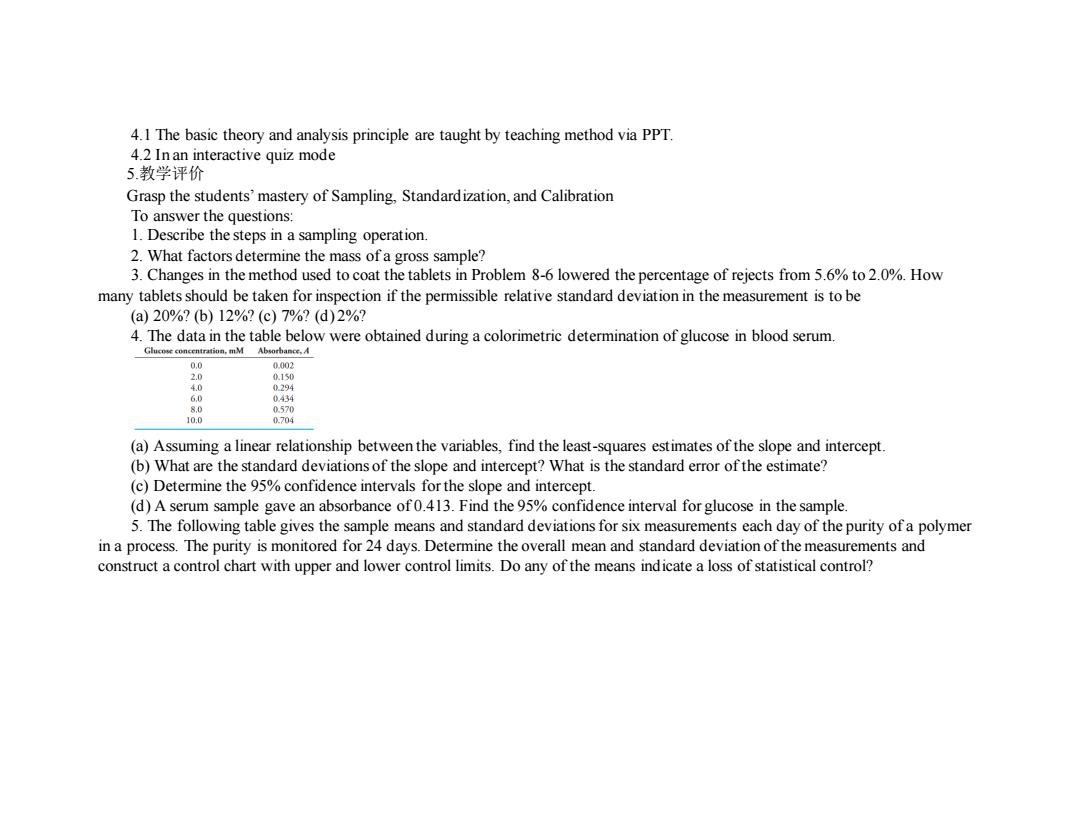
4.I The basic theory and analysis principle are taught by teaching method via PPT. 4.2 In an interactive quiz mode 5.教学评价 Grasp the students'mastery of Sampling,Standard ization,and Calibration To answer the questions: 1.Describe the steps in a sampling operation. 2.What factors determine the mass of a gross sample? 3.Changes in the method used to coat the tablets in Problem 8-6 lowered the percentage of rejects from 5.6%to 2.0%.How many tablets should be taken for inspection if the permissible relative standard deviation in the measurement is to be (a)20%?(b)12%?(c)7%?(d)2%? 4.The data in the table below were obtained during a colorimetric determination of glucose in blood serum. Glucose concentration,mM Absorbance,A 0,0 0002 2.0 0.150 4.0 0.294 6.0 0.434 8.0 0.570 10.0 0.704 (a)Assuming a linear relationship between the variables,find the least-squares estimates of the slope and intercept. (b)What are the standard deviations of the slope and intercept?What is the standard error of the estimate? (c)Determine the 95%confidence intervals for the slope and intercept. (d)A serum sample gave an absorbance of 0.413.Find the 95%confidence interval for glucose in the sample. 5.The following table gives the sample means and standard deviations for six measurements each day of the purity of a polymer in a process.The purity is monitored for 24 days.Determine the overall mean and standard deviation of the measurements and construct a control chart with upper and lower control limits.Do any of the means indicate a loss of statistical control?
4.1 The basic theory and analysis principle are taught by teaching method via PPT. 4.2 In an interactive quiz mode 5.教学评价 Grasp the students’ mastery of Sampling, Standardization, and Calibration To answer the questions: 1. Describe the steps in a sampling operation. 2. What factors determine the mass of a gross sample? 3. Changes in the method used to coat the tablets in Problem 8-6 lowered the percentage of rejects from 5.6% to 2.0%. How many tablets should be taken for inspection if the permissible relative standard deviation in the measurement is to be (a) 20%? (b) 12%? (c) 7%? (d) 2%? 4. The data in the table below were obtained during a colorimetric determination of glucose in blood serum. (a) Assuming a linear relationship between the variables, find the least-squares estimates of the slope and intercept. (b) What are the standard deviations of the slope and intercept? What is the standard error of the estimate? (c) Determine the 95% confidence intervals for the slope and intercept. (d) A serum sample gave an absorbance of 0.413. Find the 95% confidence interval for glucose in the sample. 5. The following table gives the sample means and standard deviations for six measurements each day of the purity of a polymer in a process. The purity is monitored for 24 days. Determine the overall mean and standard deviation of the measurements and construct a control chart with upper and lower control limits. Do any of the means indicate a loss of statistical control?
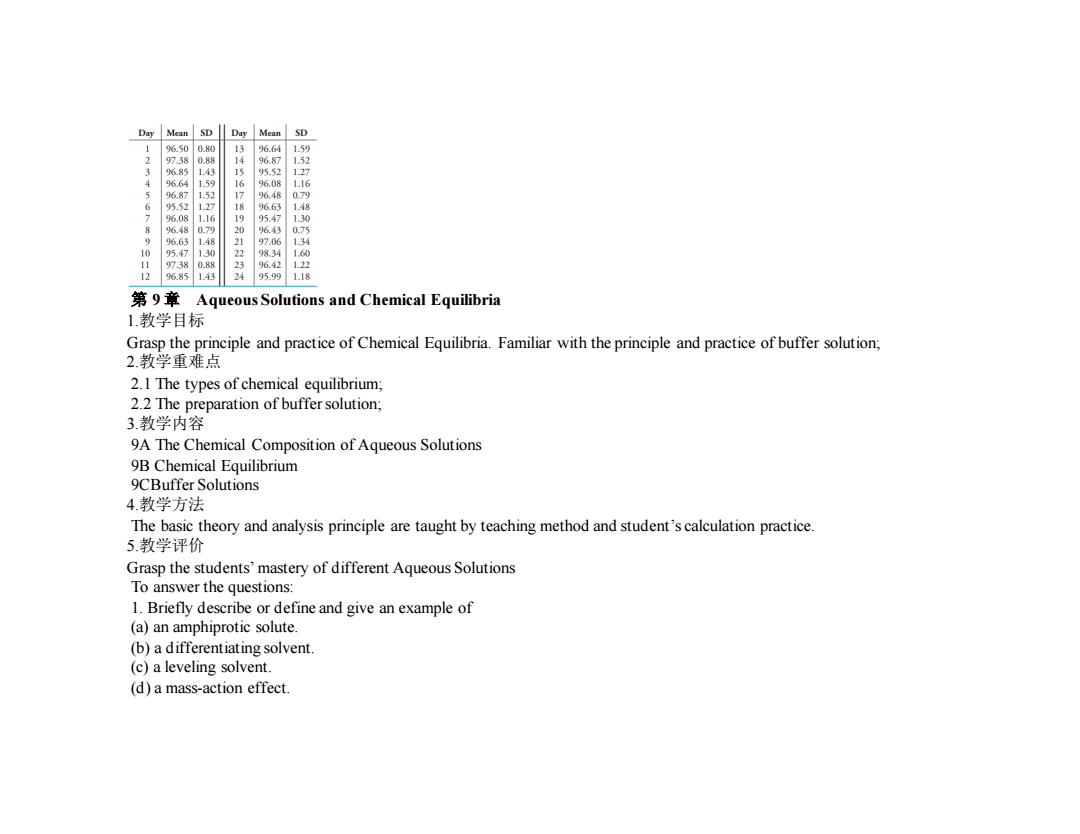
Day Mean SD D可 Mean SD 1 6.50 080 96.64 1.59 97.38 0 14 96.87 1.52 3 6.85 143 95.52 127 96.64 1.59 96.08 1.16 5 96.87 1.52 17 96.48 0.79 95.52 127 96.63 1.48 96.08 1.10 95.47 130 96.48 0.79 96.43 0.75 9 96.63 1.48 21 97.06 134 10 95.47 130 9834 160 97.38 0.88 23 96.42 122 12 96.85 1.43 24 95.99 1.18 第9章 Aqueous Solutions and Chemical Equilibria 1.教学目标 Grasp the principle and practice of Chemical Equilibria.Familiar with the principle and practice of buffer solution; 2.教学重难点 2.1 The types of chemical equilibrium; 2.2 The preparation of buffer solution; 3.教学内容 9A The Chemical Composition of Aqueous Solutions 9B Chemical Equilibrium 9CBuffer Solutions 4.教学方法 The basic theory and analysis principle are taught by teaching method and student's calculation practice. 5.教学评价 Grasp the students'mastery of different Aqueous Solutions To answer the questions: 1.Briefly describe or define and give an example of (a)an amphiprotic solute (b)a differentiating solvent. (c)a leveling solvent. (d)a mass-action effect
第 9 章 Aqueous Solutions and Chemical Equilibria 1.教学目标 Grasp the principle and practice of Chemical Equilibria. Familiar with the principle and practice of buffer solution; 2.教学重难点 2.1 The types of chemical equilibrium; 2.2 The preparation of buffer solution; 3.教学内容 9A The Chemical Composition of Aqueous Solutions 9B Chemical Equilibrium 9CBuffer Solutions 4.教学方法 The basic theory and analysis principle are taught by teaching method and student’s calculation practice. 5.教学评价 Grasp the students’ mastery of different Aqueous Solutions To answer the questions: 1. Briefly describe or define and give an example of (a) an amphiprotic solute. (b) a differentiating solvent. (c) a leveling solvent. (d) a mass-action effect